 Zůstat
Obchodní podmínky
Nástroje


The growth rate of consumer prices in the United Kingdom has slowed from 10.1% to 8.7%, slightly worse than the forecasted value of 8.5%. This temporary statistic supported the British currency as investors began considering a possible increase in the interest rate by the Bank of England.
However, after the publication of the statistical data, the Governor of the Bank of England, Andrew Bailey, made a speech stating that the pace of consumer price growth would decrease by half by the end of the year, effectively ruling out the possibility of further interest rate hikes. Although he did not mention interest rates specifically, this information changed investors' sentiment, and they started selling the British currency.

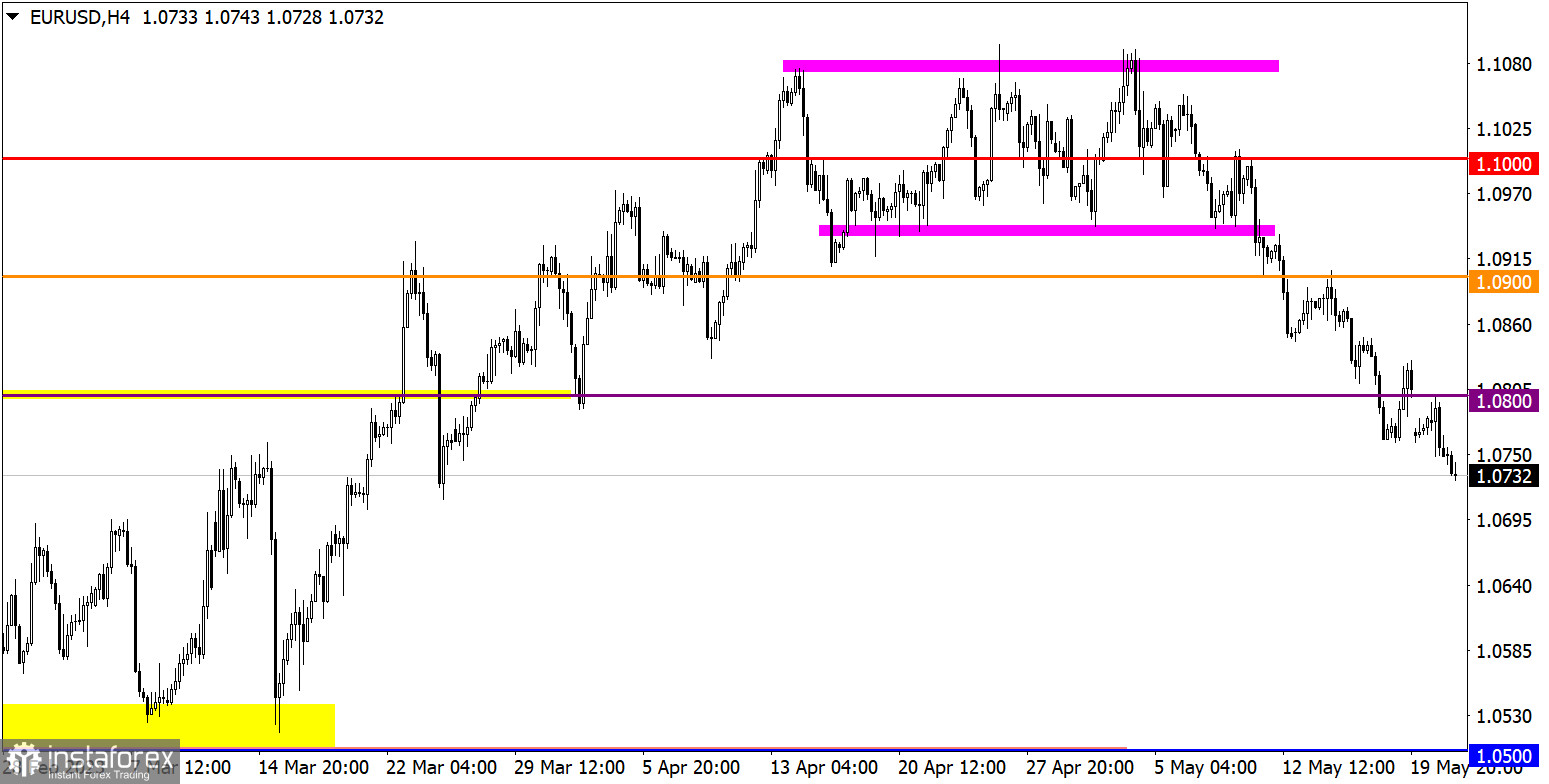
During an intense downward movement, EUR/USD extended the ongoing corrective trend in the market. The scale of the euro's depreciation since the beginning of the month amounts to about 3%, which is quite significant and can be considered an inertial movement.
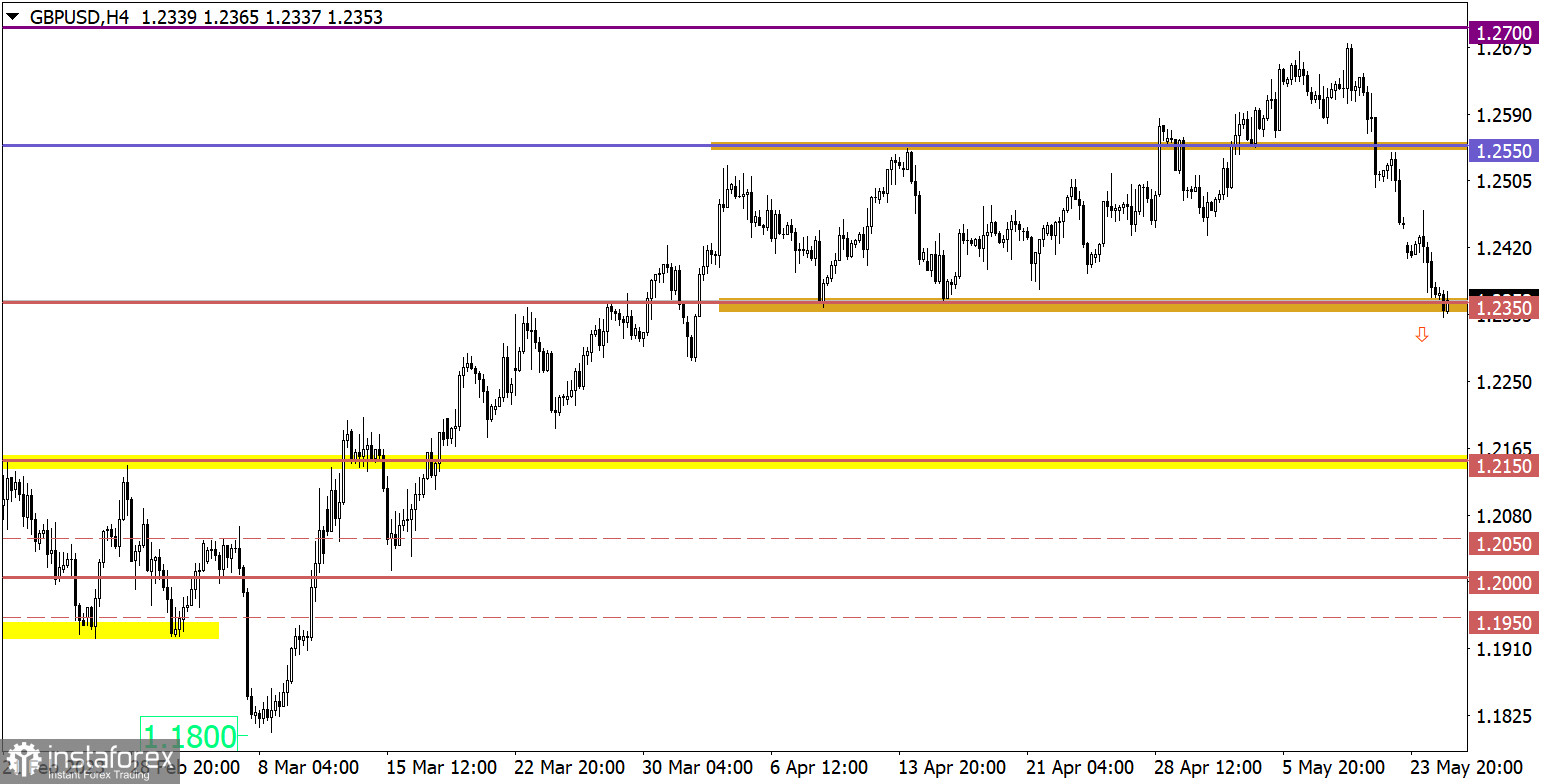
GBP/USD also continued its intense downward movement, breaking below the 1.2350 support level. This indicates that traders are inclined towards short positions, ignoring technical signals of oversold conditions in the short-term and intraday periods.
During the U.S. trading session, weekly jobless claims in the United States will be published, with a forecast of a slight increase in the overall figure. The details of the statistical data indicate that the number of continuing claims may rise from 1.799 million to 1.8 million, while the number of initial claims may rise from 242,000 to 245,000.
Time targeting:
U.S. Jobless Claims – 12:30 UTC
Currently, a technical oversold signal for the euro is observed in the short-term and time periods. However, speculators are ignoring this signal, leading to inertia in price movement. It is important to note that there will be a consolidation of short positions sooner or later, which may result in a technical rebound.
Stable price holding below the level of 1.2350 may lead to further decline. In this case, the current correction from the peak of the medium-term trend may turn into a prolonged correction. However, despite this, the medium-term trend will still remain upward.
Regarding the bullish scenario, traders view it as a staged recovery. To realize it, the quote must first slow down its downward cycle and consistently hold the price above the level of 1.2350. Subsequently, there may be a staged increase in long positions on the British pound.
The candlestick chart type is white and black graphic rectangles with lines above and below. With a detailed analysis of each individual candle, you can see its characteristics relative to a particular time frame: opening price, closing price, intraday high and low.
Horizontal levels are price coordinates, relative to which a price may stop or reverse its trajectory. In the market, these levels are called support and resistance.
Circles and rectangles are highlighted examples where the price reversed in history. This color highlighting indicates horizontal lines that may put pressure on the asset's price in the future.
The up/down arrows are landmarks of the possible price direction in the future.
Díky analytickým přehledům společnosti InstaForex získáte plné povědomi o tržních trendech! Jako zákazníkovi společnosti InstaForex je Vám k dispozici velký počet bezplatných služeb umožňujících efektivní obchodování.


