 Zůstat
Obchodní podmínky
Nástroje


The EUR/USD pair resumed its downward movement on Wednesday, despite breaking out of the descending channel earlier in the day. However, we already warned you that this could be a false breakout as it occurred within a flat pattern. Therefore, it is not considered valid. We confirmed this on Wednesday. The euro started falling during the night, indicating that Tuesday's growth was illogical. In the previous article, we mentioned that there were no reasons for the euro to rise. And there were still no reasons on Wednesday. Germany released its inflation report, which showed a steep slowdown. Remember that the faster inflation falls, the fewer reasons the European Central Bank has to further raise rates. Therefore, this is a bearish factor for the euro. The Job Openings report was released in the United States, showing a much higher value than forecasted. Hence, both of the day's most important reports supported the dollar.
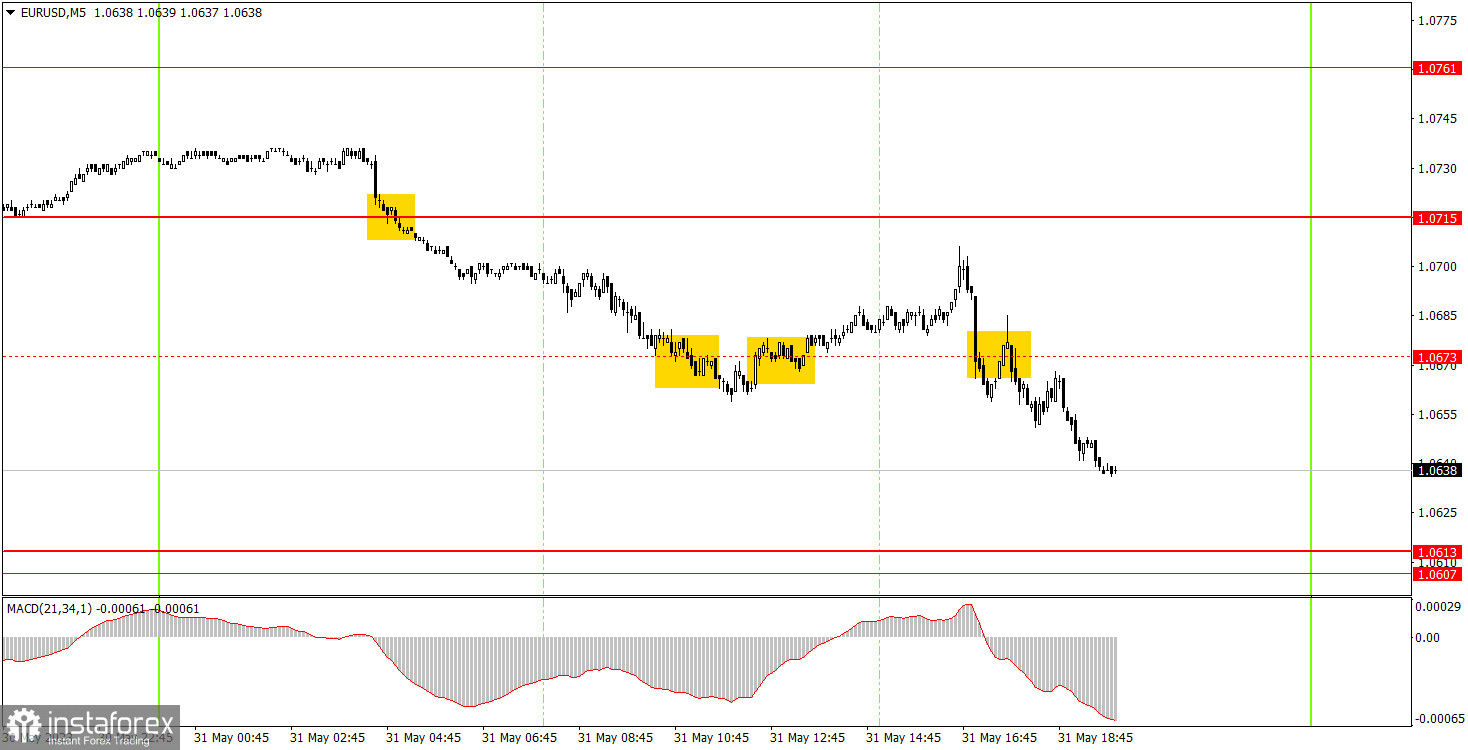
The 5-minute chart showed that the pair traded in all directions on Wednesday. The first sell signal formed during the night, and it could have been executed with a short position at the opening of the European session. Later, the pair dropped below 1.0673 but couldn't extend the decline. Therefore, the next buy signal should have been used to close the shorts with a profit of about 15 pips. A long position opened based on the signal around 1.0673 (the level was removed at the end of the day) closed at the Stop Loss with no profit, as the pair did not reach the target level. The next sell signal brought newcomers another 25 pips, and the trade should have been manually closed closer to the evening.
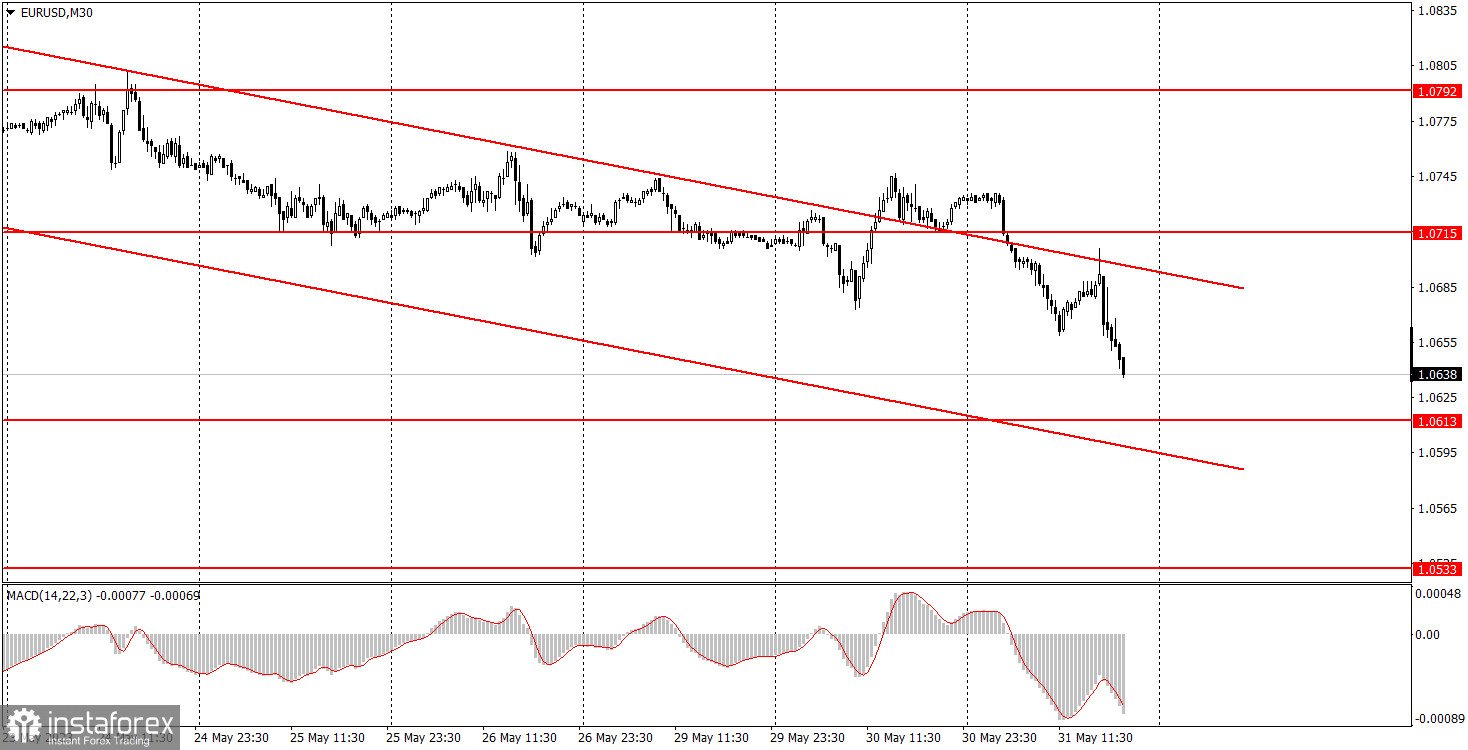
As seen on the 30M chart, the pair continues moving downward despite breaking out of the descending channel. Wednesday's macroeconomic background had a significant influence on the pair's movement, and Thursday and Friday's impact may be even more significant. The key levels on the 5M chart are 1.0517-1.0533, 1.0607-1.0613, 1.0715, 1.0761, 1.0792, 1.0857-1.0867. A stop loss can be set at a breakeven point as soon as the price moves 15 pips in the right direction. On Thursday, ECB President Christine Lagarde is scheduled to speak in the European Union, and reports on unemployment and inflation will also be published. All three events are deemed important. In the United States, we are looking forward to reports on unemployment claims, the ADP report, ISM and S&P Manufacturing PMI. These are all significant. Therefore, volatility may gradually increase and the pair may frequently change its direction.
1) The strength of the signal depends on the time period during which the signal was formed (a rebound or a break). The shorter this period, the stronger the signal.
2) If two or more trades were opened at some level following false signals, i.e. those signals that did not lead the price to Take Profit level or the nearest target levels, then any consequent signals near this level should be ignored.
3) During the flat trend, any currency pair may form a lot of false signals or do not produce any signals at all. In any case, the flat trend is not the best condition for trading.
4) Trades are opened in the time period between the beginning of the European session and until the middle of the American one when all deals should be closed manually.
5) We can pay attention to the MACD signals in the 30M time frame only if there is good volatility and a definite trend confirmed by a trend line or a trend channel.
6) If two key levels are too close to each other (about 5-15 pips), then this is a support or resistance area.
Support and Resistance price levels can serve as targets when buying or selling. You can place Take Profit levels near them.
Red lines are channels or trend lines that display the current trend and show which direction is better to trade.
MACD indicator (14,22,3) is a histogram and a signal line showing when it is better to enter the market when they cross. This indicator is better to be used in combination with trend channels or trend lines.
Important speeches and reports that are always reflected in the economic calendars can greatly influence the movement of a currency pair. Therefore, during such events, it is recommended to trade as carefully as possible or exit the market in order to avoid a sharp price reversal against the previous movement.
Beginners should remember that every trade cannot be profitable. The development of a reliable strategy and money management are the key to success in trading over a long period of time.
Díky analytickým přehledům společnosti InstaForex získáte plné povědomi o tržních trendech! Jako zákazníkovi společnosti InstaForex je Vám k dispozici velký počet bezplatných služeb umožňujících efektivní obchodování.


