 Zůstat
Obchodní podmínky
Nástroje


The Eurostat data indicates that retail sales in the EU remained at the same level as the previous month in April 2023, which was below economists' expectations of a slight growth. The revised data also shows that the indicator decreased less significantly in March than previously assumed. When comparing the data with the same period a year earlier, a slowdown in the pace of decline is noted. These indicators can serve as indicators of economic activity and can influence decisions and forecasts regarding further market development.
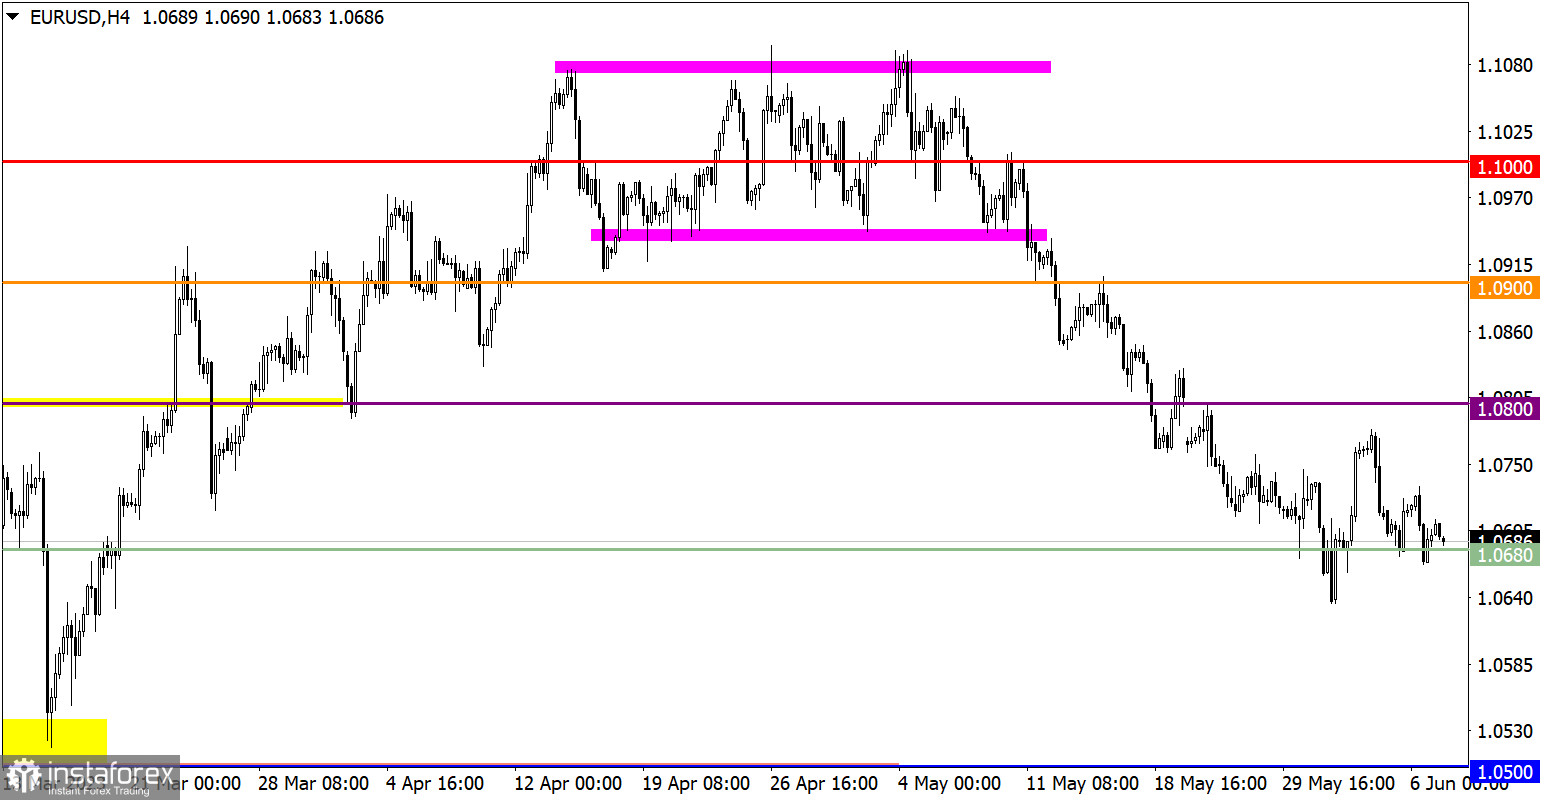
Once again, EUR/USD showed a downward trend, despite the fact that the scale of the current corrective move from the high of the medium-term trend already amounts to 450 points.
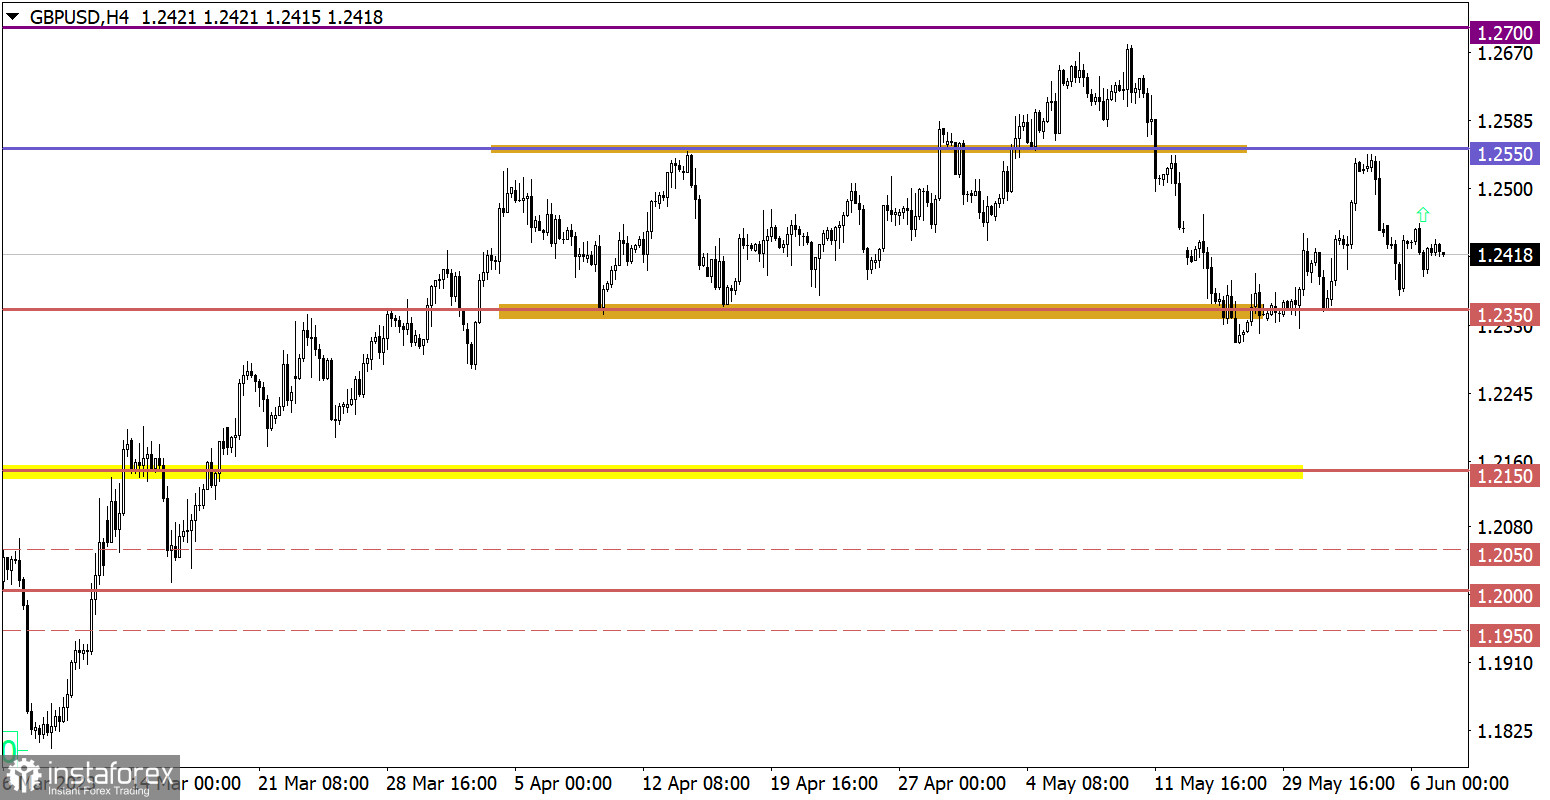
Although the GBP/USD quote managed to rebound from the area of 1.2350 support level, no radical changes were observed. The recent recovery move was undermined by sellers, and the downward trend is still maintained.

In this situation, when the macroeconomic calendar is empty and no important statistical data is expected, market participants will pay special attention to the information flow. They can follow the news, speeches of central bank officials, political events, or other factors that can influence financial markets. In such cases, traders and investors can rely on fundamental data analysis, technical analysis, and their own assessments of the situation to make trading decisions.
If speculators continue to ignore the technical signal of overbought dollar positions, it may lead to the prolongation of the current corrective cycle. However, the level of the euro's weakening indicates that sellers are in a vulnerable position. If technical signals are not ignored in the market, a stagnation in the form of a short-term flat, a period of no clear price movement, is possible. In such situations, traders can expect the market to be in a sideways trend, without a clear trend in either direction.
In order for the volume of short positions to resume growth, the quote needs to return to the level of 1.2350. This step may indicate the possibility of breaking the support level and prolonging the current corrective move from the medium-term trend high. For a bullish scenario to be considered, the quote needs to hold above the value of 1.2450, which can open the way for further growth in the currency pair's value. However, note that the market is influenced by multiple factors, and the final direction of price movement may depend on their interaction and subsequent events.
The candlestick chart type is white and black graphic rectangles with lines above and below. With a detailed analysis of each individual candle, you can see its characteristics relative to a particular time frame: opening price, closing price, intraday high and low.
Horizontal levels are price coordinates, relative to which a price may stop or reverse its trajectory. In the market, these levels are called support and resistance.
Circles and rectangles are highlighted examples where the price reversed in history. This color highlighting indicates horizontal lines that may put pressure on the asset's price in the future.
The up/down arrows are landmarks of the possible price direction in the future.
Díky analytickým přehledům společnosti InstaForex získáte plné povědomi o tržních trendech! Jako zákazníkovi společnosti InstaForex je Vám k dispozici velký počet bezplatných služeb umožňujících efektivní obchodování.


