 Zůstat
Obchodní podmínky
Nástroje


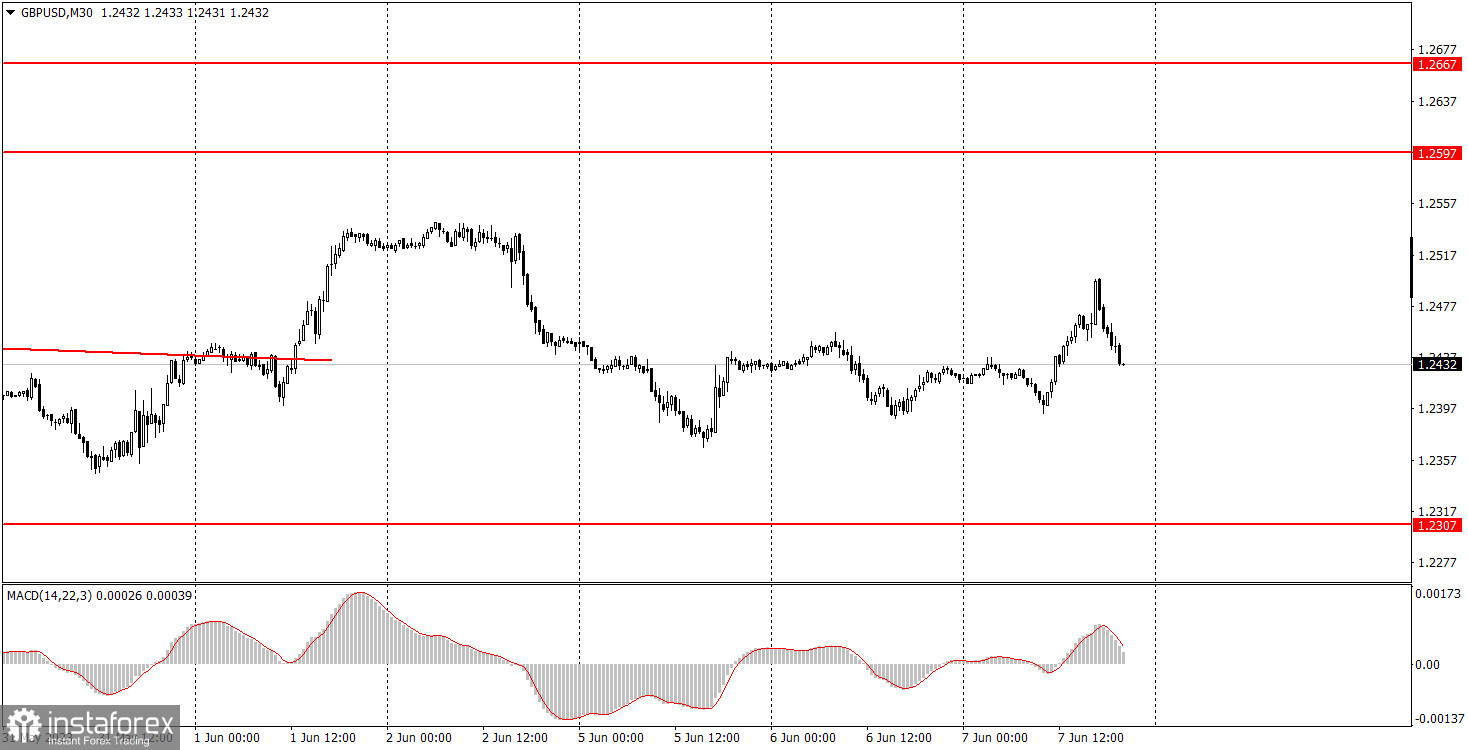
The GBP/USD pair continued to trade quite chaotically on Wednesday. Throughout the day, the pair managed to both rise and fall, but overall (as clearly seen on the 30-minute chart), it continued to move sideways. Despite breaking the downward trendline a week ago, we have yet to see an uptrend. As a result, the market has paused and remained stagnant. In a week's time, there will be the Federal Reserve meeting, followed by the announcement of results from the Bank of England and the European Central Bank in another week. However, this week lacks significant fundamental and macroeconomic factors. Traders have nothing to react to, and we have been observing directionless movements for several days now. Volatility remains relatively low. Occasionally, there are more or less volatile days, but the sideways movement persists. It is not always profitable to trade in such conditions.
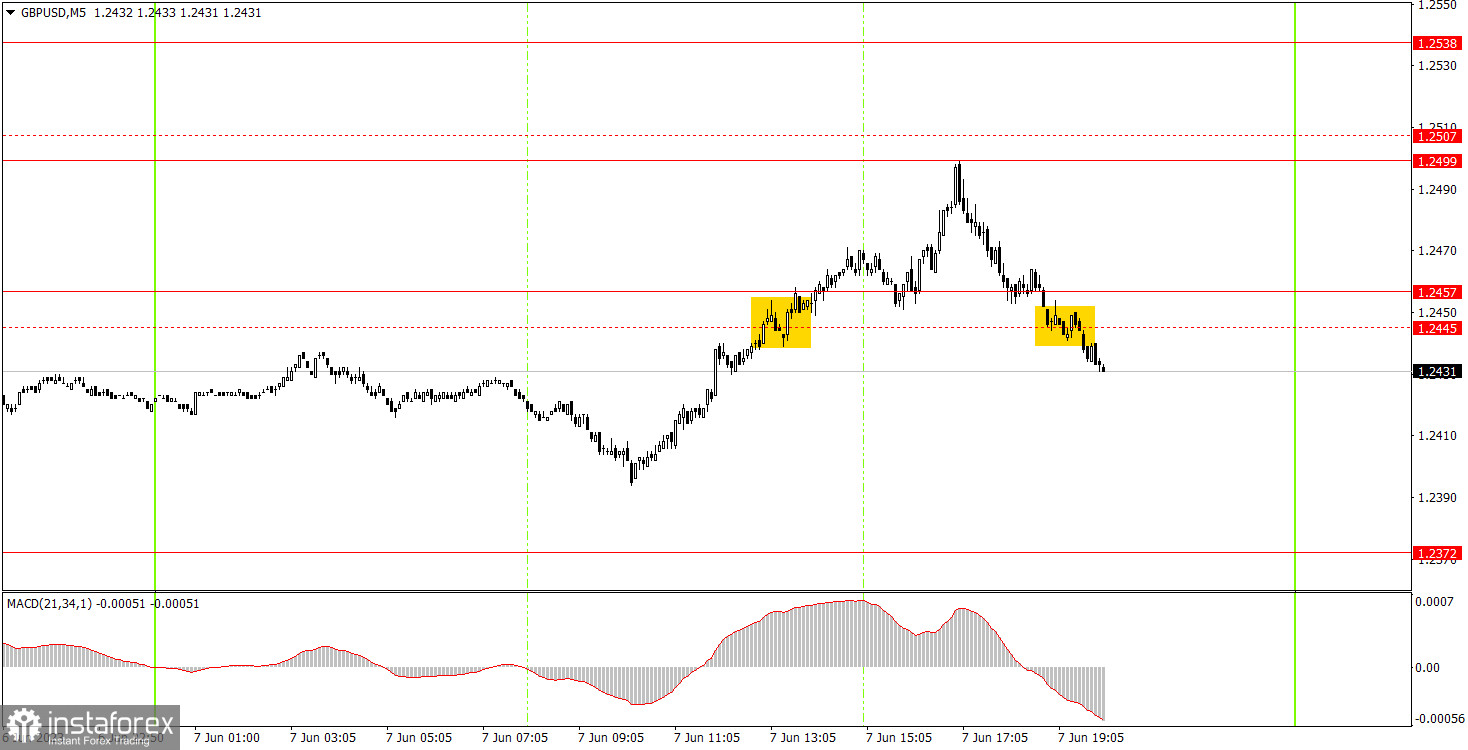
There were two trading signals on the 5-minute chart. Initially, the pair surpassed the 1.2445 level upwards, and then downwards. However, it failed to reach the target level in both cases. Two levels (1.2445 and 1.2507) were removed, and two levels (1.2457 and 1.2499) were added. Beginners could have made a profit from a long position only if the trade was closed manually, without waiting for the pair to hit the 1.2507 level. The sell signal could have garnered only a few pips as it formed quite late in the day, and it was necessary to close the trade in any price position by the evening. It was not the best day, despite the relatively volatile movements.
As seen on the 30M chart, the GBP/USD pair has ended its downtrend and started a new uptrend in the short-term. However, in reality, we haven't observed any significant upward movement yet. We believe that the pound has not fallen enough to form a new strong uptrend, so we're waiting for its decline. However, there are hardly any important reports this week, so we also recommend paying attention to higher charts. The key levels on the 5M chart are 1.2171-1.2179, 1.2245, 1.2307, 1.2372, 1.2457, 1.2499, 1.2538, 1.2597-1.2616, 1.2659, 1.2697. When the price moves 20 pips in the right direction after opening a trade, a stop loss can be set at breakeven. In the UK, there are no significant events lined up. In the US, there will be unemployment claims, which have minimal impact and rarely surprise traders. Most likely, we should brace ourselves for another low-volatility day.
1) The strength of the signal depends on the time period during which the signal was formed (a rebound or a break). The shorter this period, the stronger the signal.
2) If two or more trades were opened at some level following false signals, i.e. those signals that did not lead the price to Take Profit level or the nearest target levels, then any consequent signals near this level should be ignored.
3) During the flat trend, any currency pair may form a lot of false signals or do not produce any signals at all. In any case, the flat trend is not the best condition for trading.
4) Trades are opened in the time period between the beginning of the European session and until the middle of the American one when all deals should be closed manually.
5) We can pay attention to the MACD signals in the 30M time frame only if there is good volatility and a definite trend confirmed by a trend line or a trend channel.
6) If two key levels are too close to each other (about 5-15 pips), then this is a support or resistance area.
Support and Resistance price levels can serve as targets when buying or selling. You can place Take Profit levels near them.
Red lines are channels or trend lines that display the current trend and show which direction is better to trade.
MACD indicator (14,22,3) is a histogram and a signal line showing when it is better to enter the market when they cross. This indicator is better to be used in combination with trend channels or trend lines.
Important speeches and reports that are always reflected in the economic calendars can greatly influence the movement of a currency pair. Therefore, during such events, it is recommended to trade as carefully as possible or exit the market in order to avoid a sharp price reversal against the previous movement.
Beginners should remember that every trade cannot be profitable. The development of a reliable strategy and money management are the key to success in trading over a long period of time.
Díky analytickým přehledům společnosti InstaForex získáte plné povědomi o tržních trendech! Jako zákazníkovi společnosti InstaForex je Vám k dispozici velký počet bezplatných služeb umožňujících efektivní obchodování.


