 Zůstat
Obchodní podmínky
Nástroje


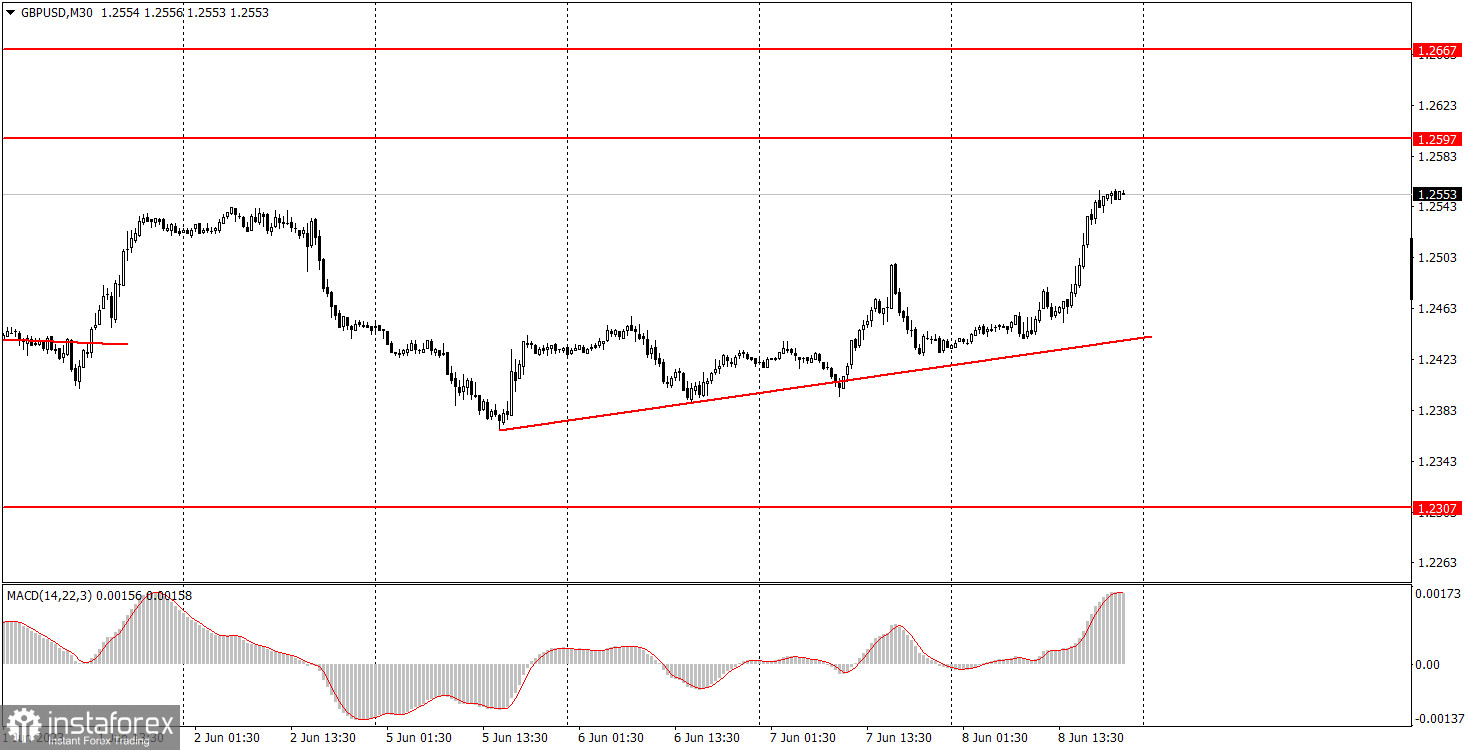
The GBP/USD pair encountered an impressive growth on Thursday, which was not triggered by any fundamental or macroeconomic factors. Thus, the British pound simply rose more than 100 pips out of nowhere. There were no important or even mildly interesting reports for the British currency on Thursday, giving traders nothing to react to during the day. Nevertheless, it seems that the pound is getting stronger again, which is difficult to explain. As a new uptrend has formed, we have drawn an upward trendline. The pound's movements are currently very difficult to predict as there is little logic behind them. The market is trying to rely only on expectations regarding the interest rates of the Federal Reserve and the Bank of England, but even in this case, it is very difficult to explain why the pound is rising again.
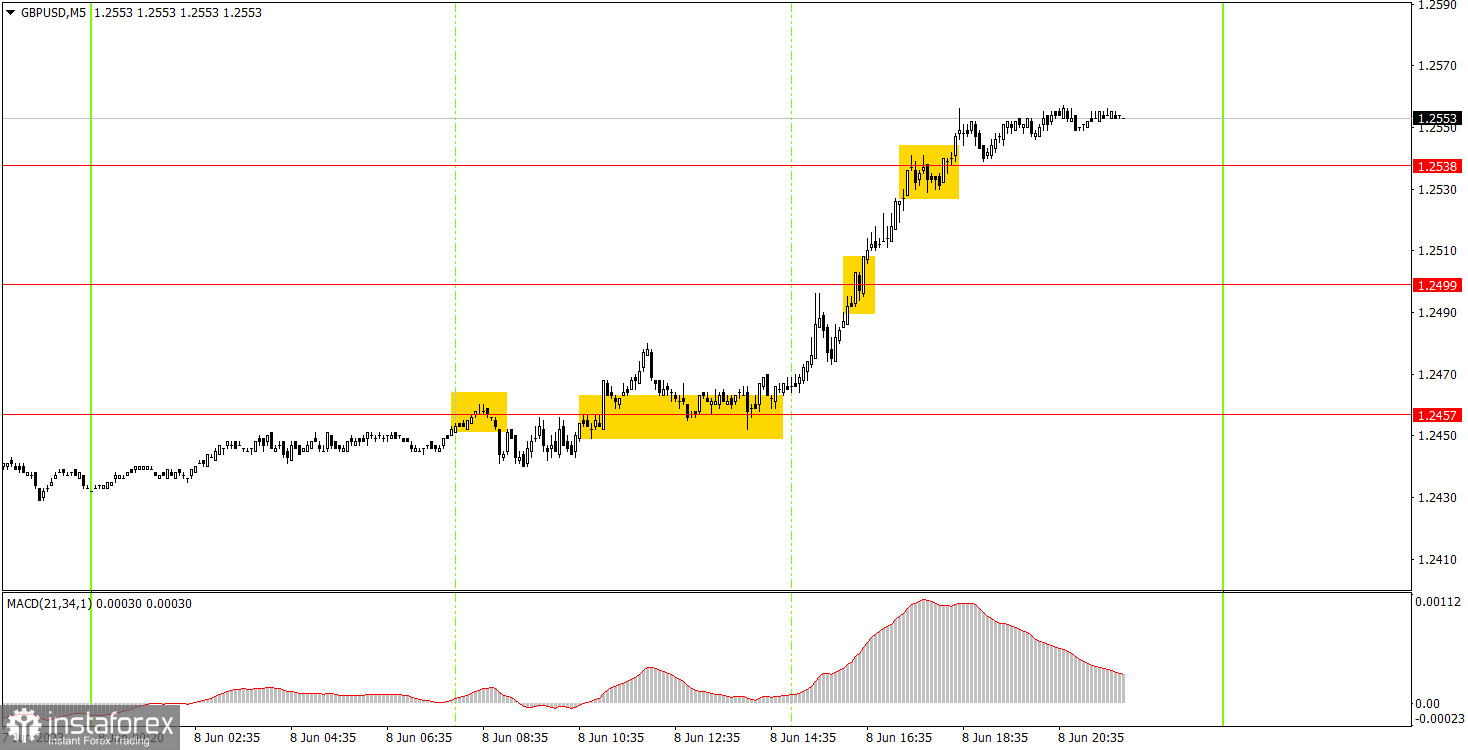
Three trading signals materialized on the 5-minute chart. At the beginning, there was a false sell signal around the level of 1.2457. Beginners incurred a small loss from it as the price settled above that level within an hour. However, subsequently, the pair only moved upward, allowing for good profits and offsetting the loss from the first trade. After passing through the level of 1.2457, the pair reached levels of 1.2499 and 1.2538 before calming down. Thus, beginners could have gained a profit of 85 pips from the long position. The loss from the first trade amounted to 25 pips.
As seen on the 30M chart, the GBP/USD pair ended the downtrend and started a new uptrend in the short-term. However, in reality, we haven't observed any significant upward movement yet. We believe that the pound has not fallen enough to form a new strong uptrend, so we're waiting for it to fall. The key levels on the 5M chart are 1.2171-1.2179, 1.2245, 1.2307, 1.2372, 1.2457, 1.2499, 1.2538, 1.2597-1.2616, 1.2659, 1.2697. When the price moves 20 pips in the right direction after opening a trade, a stop loss can be set at breakeven. In the US and the UK, there are no significant events lined up. Not even any secondary ones. Traders will have nothing to react to, and the movements can continue to be completely random.
1) The strength of the signal depends on the time period during which the signal was formed (a rebound or a break). The shorter this period, the stronger the signal.
2) If two or more trades were opened at some level following false signals, i.e. those signals that did not lead the price to Take Profit level or the nearest target levels, then any consequent signals near this level should be ignored.
3) During the flat trend, any currency pair may form a lot of false signals or do not produce any signals at all. In any case, the flat trend is not the best condition for trading.
4) Trades are opened in the time period between the beginning of the European session and until the middle of the American one when all deals should be closed manually.
5) We can pay attention to the MACD signals in the 30M time frame only if there is good volatility and a definite trend confirmed by a trend line or a trend channel.
6) If two key levels are too close to each other (about 5-15 pips), then this is a support or resistance area.
Support and Resistance price levels can serve as targets when buying or selling. You can place Take Profit levels near them.
Red lines are channels or trend lines that display the current trend and show which direction is better to trade.
MACD indicator (14,22,3) is a histogram and a signal line showing when it is better to enter the market when they cross. This indicator is better to be used in combination with trend channels or trend lines.
Important speeches and reports that are always reflected in the economic calendars can greatly influence the movement of a currency pair. Therefore, during such events, it is recommended to trade as carefully as possible or exit the market in order to avoid a sharp price reversal against the previous movement.
Beginners should remember that every trade cannot be profitable. The development of a reliable strategy and money management are the key to success in trading over a long period of time.
Díky analytickým přehledům společnosti InstaForex získáte plné povědomi o tržních trendech! Jako zákazníkovi společnosti InstaForex je Vám k dispozici velký počet bezplatných služeb umožňujících efektivní obchodování.

