 Zůstat
Obchodní podmínky
Nástroje


Cryptocurrency experts foresee significant gains in BTC valuation, projecting a surge to $77,000 this year, a promising outlook for investors.
Key Takeaways:

Experts at Finder have revised Bitcoin's price forecasts for 2024, with a prevailing bullish sentiment indicating robust growth potential. The consensus among industry professionals places BTC's value at an impressive $77,423 by year-end, signaling a positive trajectory for investors worldwide.
The forecast reflects a notable shift from previous expectations, with BTC's projected valuation surpassing $100,000 by 2025 and $300,000 by 2030, as indicated by the panel's long-term predictions. This optimistic outlook underscores the maturing confidence in Bitcoin's resilience and market dominance.
Technical Market Outlook:
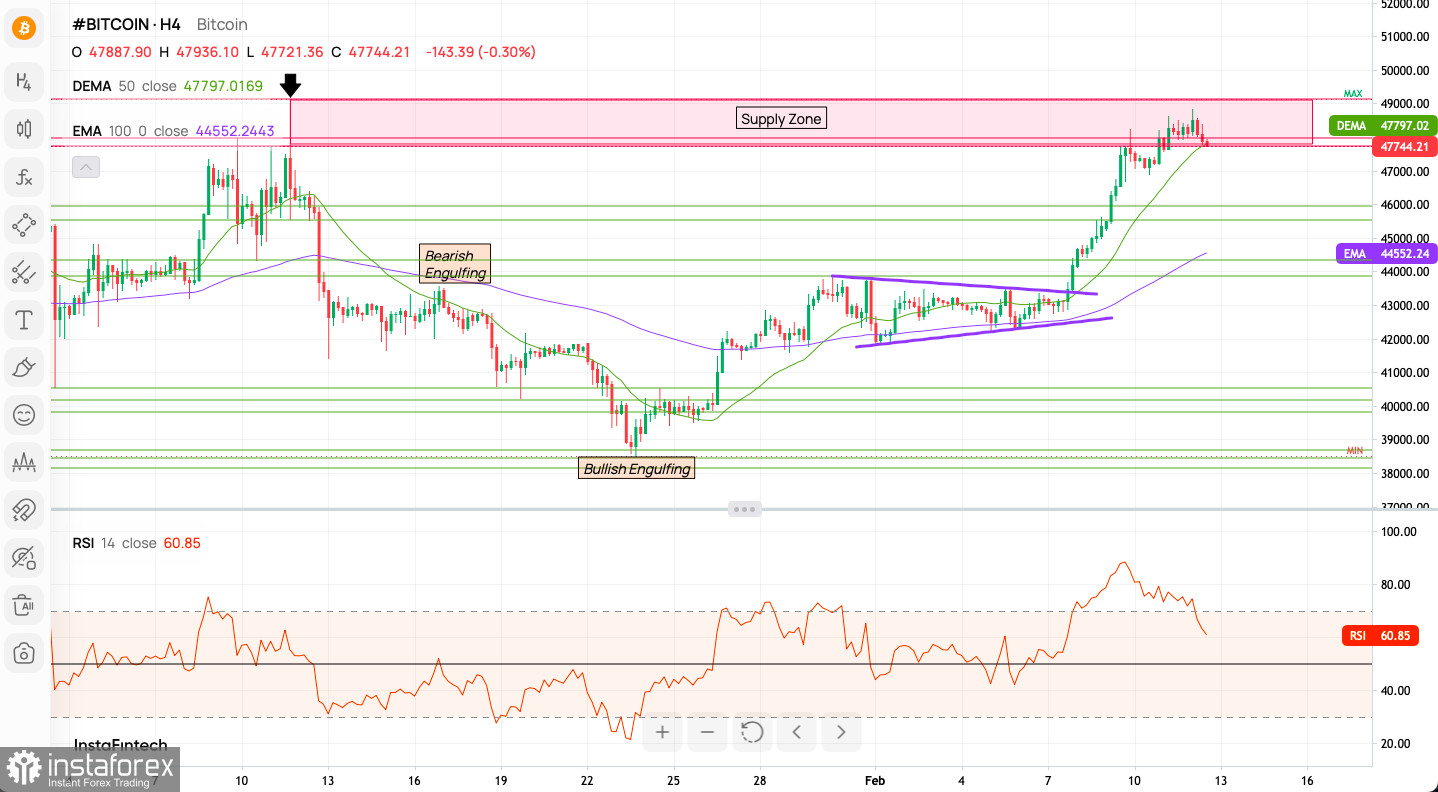
BTC/USD recent breakout from a triangle pattern, coupled with a surge past the 100% Fibonacci extension, sets the stage for further upward momentum. Despite overbought conditions, the larger timeframe trend remains bullish, with key support levels reinforcing the optimistic sentiment.
BTC/USD Technical Analysis:
Moving averages indicate a bullish trend, with Bitcoin trading comfortably above crucial support levels. The presence of 'Bullish Engulfing' patterns underscores robust buying interest, further fueling optimism among investors.
Intraday Indicator Signals:
While technical indicators exhibit a predominantly bullish bias, traders remain vigilant of potential reversals, with sentiment scores reflecting a bullish dominance in the market sentiment.
As Bitcoin charts its course towards new highs, traders must exercise caution amidst heightened volatility. Leveraging technical insights and strategic pivot points can aid in optimizing trading decisions, whether capitalizing on bullish momentum or navigating potential reversals.
Traders often use pivot points in conjunction with other indicators and price patterns. For instance, if Bitcoin's price action this week remains above the WP and approaches WR1, traders might watch for either a continuation of the bullish trend or a potential reversal if WR1 holds strong. Conversely, if the price drops below the WP towards WS1 or WS2, it would be seen as a bearish indication, with the potential for further declines if those support levels fail to hold.
Moreover, pivot points can also be used to set stop-loss orders or profit targets. For example, a trader who takes a long position near a support level might set a stop loss just below that support and a profit target near the next resistance level.
Bullish Scenario: Continued momentum above key moving averages and supply zones could propel BTC towards $50,000, affirming the uptrend's resilience. Sustained RSI levels above 50 reinforce bullish momentum, signaling further upside potential.
Bearish Scenario: Increased selling pressure at critical resistance levels may trigger a pullback, potentially reversing BTC's gains. Monitoring RSI divergence and support-turned-resistance levels is essential to identify early signs of a bearish reversal.
The begginers in forex trading need to be very careful when making decisions about entering the market. Before the release of important reports, it is best to stay out of the market to avoid being caught in sharp market fluctuations due to increased volatility. If you decide to trade during the news release, then always place stop orders to minimize losses.
Without placing stop orders, you can very quickly lose your entire deposit, especially if you do not use money management and trade large volumes. For successful trading, you need to have a clear trading plan and stay focues and disciplined. Spontaneous trading decision based on the current market situation is an inherently losing strategy for a scalper or daytrader.
Díky analytickým přehledům společnosti InstaForex získáte plné povědomi o tržních trendech! Jako zákazníkovi společnosti InstaForex je Vám k dispozici velký počet bezplatných služeb umožňujících efektivní obchodování.


