 Zůstat
Obchodní podmínky
Nástroje


Federal Reserve Chairman Jerome Powell's speech on Thursday was interpreted by investors as cautious, leaning toward maintaining the monetary policy unchanged. Although Powell did not rule out the possibility of further interest rate hikes, he did emphasize that this is only in the presence of clear evidence of increasing inflationary pressures.
The dollar maintains an advantage in the market, continuing to strengthen, especially against major commodity currencies. It is also in demand as a safe-haven asset in the current complex geopolitical situation worldwide. However, it seems to be trailing behind other popular safe-haven assets, such as gold and the Swiss franc.
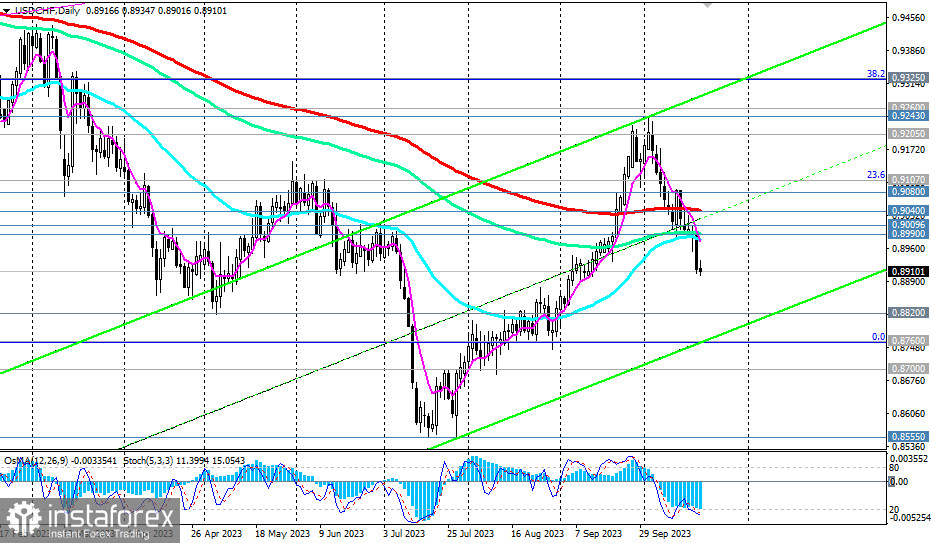
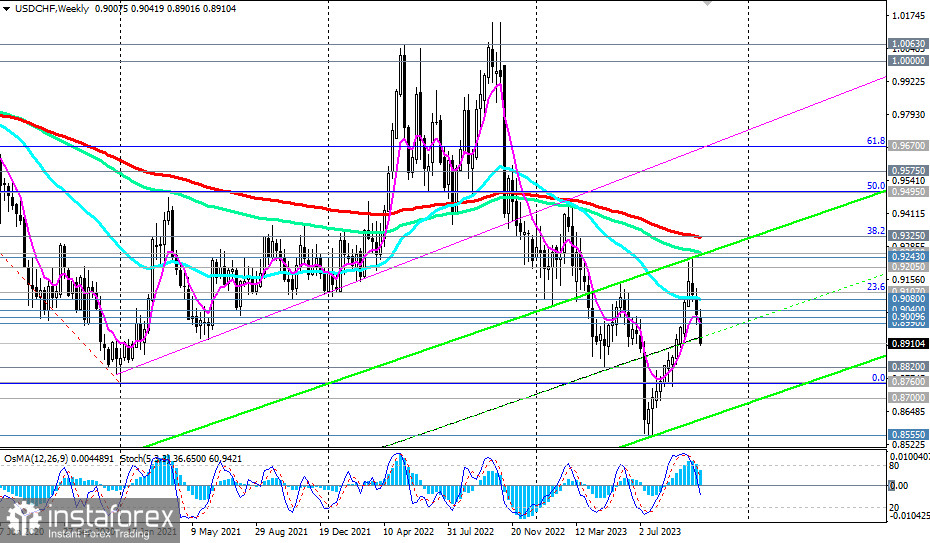
In general, USD/CHF is following a long-term bearish trend, trading in the zone of both long-term and medium-term bearish markets, below key resistance levels of 0.9040 (200 EMA on the daily chart), 0.9080 (50 EMA on the weekly chart), 0.9260 (144 EMA on the weekly chart), and 0.9325 (200 EMA on the weekly chart).
Today, USD/CHF is declining for the third consecutive week, testing the local support level at 0.8900.
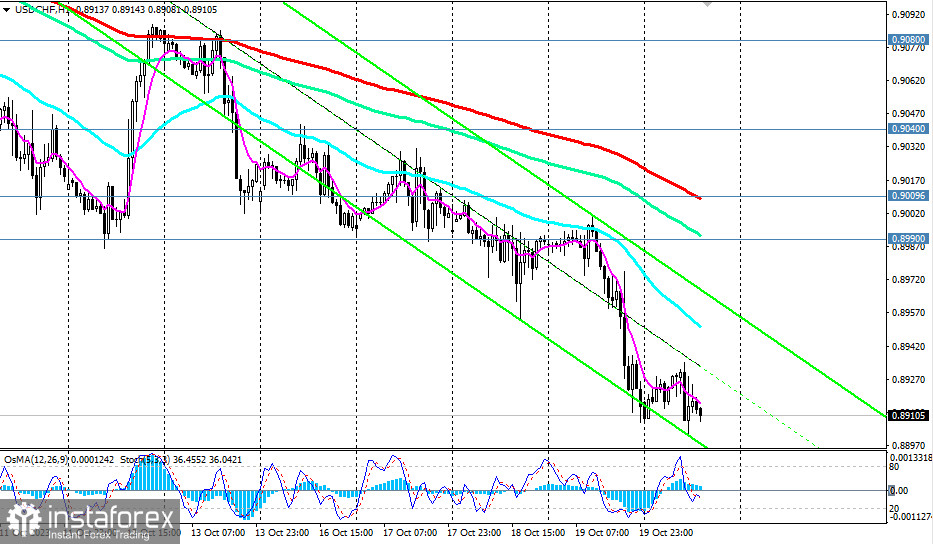
A break below this level may signal new short positions with targets near local supports levels at 0.8820, 0.8760, 0.8700, and 0.8555 (low from January 2015 when the Swiss National Bank unpegged the Swiss franc from the euro).
Technical indicators OsMA and Stochastic on daily and weekly charts are also in favor of sellers.
In an alternative scenario, the price will break through resistance levels of 0.9040, 0.9080, and 0.9107 (23.6% Fibonacci level of the upward correction wave that began in April 2019 near the 1.0235 mark) and continue to correct towards key resistance levels of 0.9250 and 0.9325. A signal to implement this scenario could be a breakout of today's high at 0.8934. However, a more significant rise is currently unlikely, considering the long-term bearish dynamics of the pair.
Support levels: 0.8900, 0.8820, 0.8800, 0.8760, 0.8700, 0.8555
Resistance levels: 0.8935, 0.8990, 0.9000, 0.9010, 0.9040, 0.9080, 0.9100, 0.9107, 0.9205, 0.9243, 0.9260, 0.9300, 0.9325
Díky analytickým přehledům společnosti InstaForex získáte plné povědomi o tržních trendech! Jako zákazníkovi společnosti InstaForex je Vám k dispozici velký počet bezplatných služeb umožňujících efektivní obchodování.


