 Zůstat
Obchodní podmínky
Nástroje


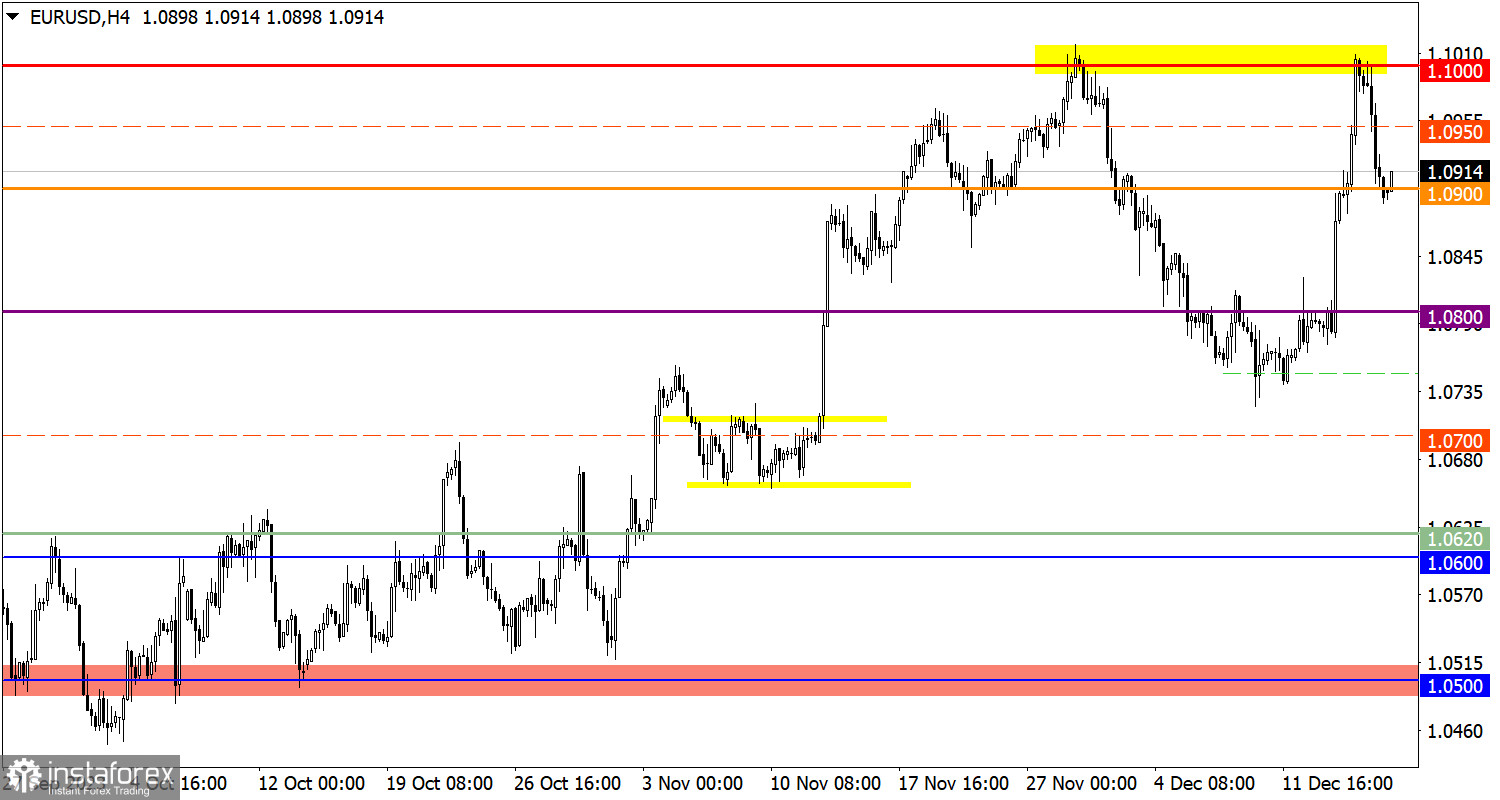
Preliminary assessment of business activity indices in the Eurozone significantly fell short of forecasts, showing a decline. The manufacturing sector's business activity index remained at the same level instead of the expected increase from 44.2 to 44.4. The services sector also decreased from 48.7 to 48.1, despite a forecast of 49.3. The composite business activity index, anticipated to rise from 47.6 to 48.0, fell to 47. These weak results led to an immediate weakening of the European currency.
Interestingly, this sentiment continued after the opening of the American trading session despite somewhat better data from the United States. The manufacturing sector's business activity index dropped from 49.4 to 48.2, slightly worse than the forecast of 49.2. However, the services sector's business activity index increased from 50.8 to 51.3, reversing the situation. The composite business activity index also rose from 50.7 to 51.0, against the expected decrease to 50.5. Industrial production showed a slowdown in the pace of decline from -1.0% to -0.4%, slightly worse than the forecast of -0.3%.

The euro reduced the volume of long positions near the resistance level of 1.1000, leading to a pullback, and the quote returned to the 1.0900 mark.
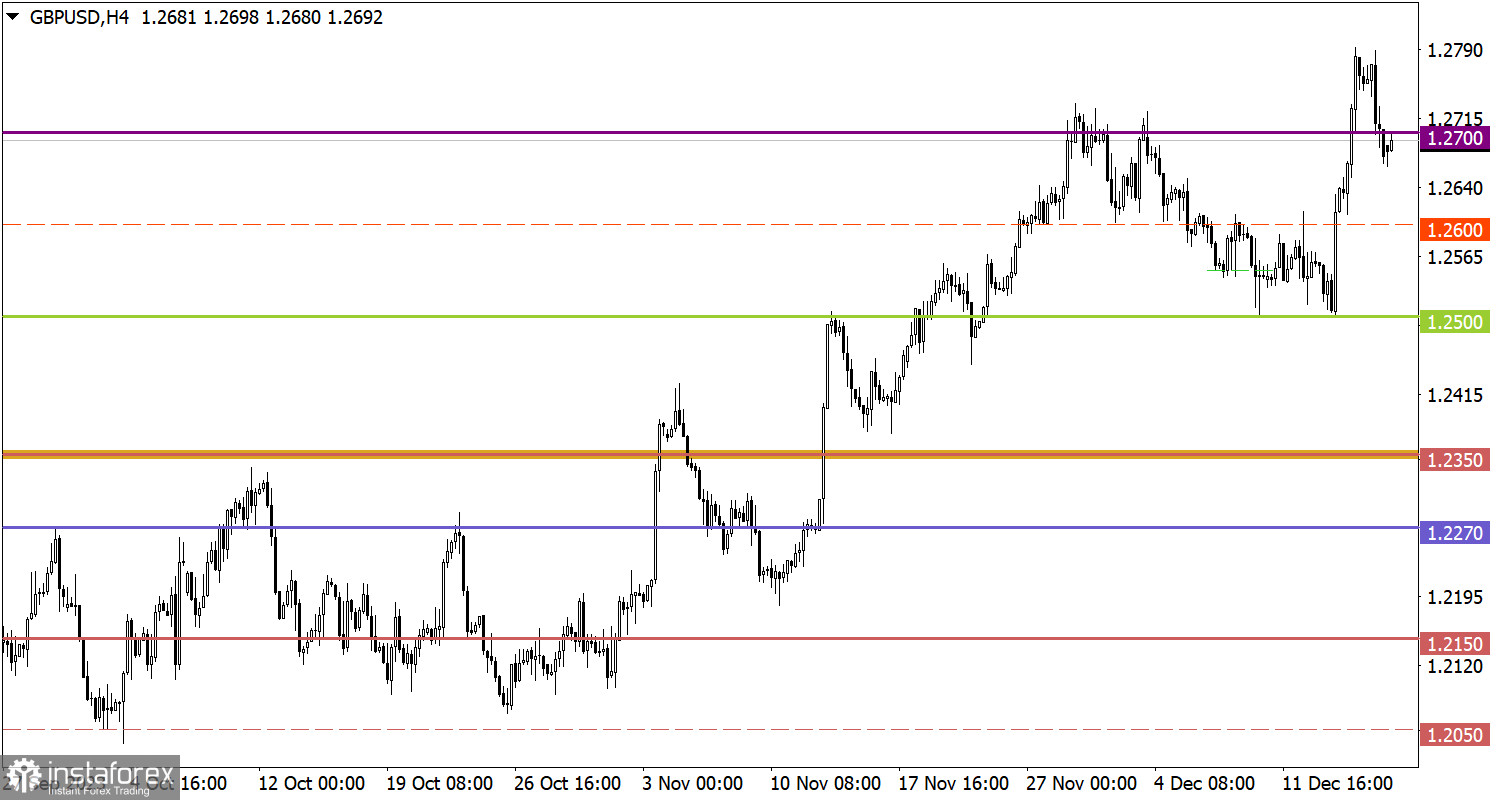
The British pound, in turn, entered a pullback stage due to a technical overbought signal. The area around the value of 1.2800 acted as resistance on the buyers' path.
As usual, Monday is accompanied by an empty macroeconomic calendar, and there are no publications of important statistical data in the European Union, the United Kingdom, and the United States.
Stabilization of the price above the level of 1.0900 in the perspective may indicate an increase in the volume of long positions. In this case, a recovery of the upward trend towards 1.1000 is possible. However, if the price remains below the value of 1.0900 during the day, this may lead to further declines, canceling the recent rise.
Despite the current pullback stage, there is still an upward dynamic in the market. Therefore, price stabilization above the level of 1.2700 may trigger the resumption of long positions, leading to the update of the local high. Regarding the current pullback, prolonged holding of the price below 1.2650 may lead to subsequent depreciation of the British pound towards 1.2600.
The candlestick chart type is white and black graphic rectangles with lines above and below. With a detailed analysis of each individual candle, you can see its characteristics relative to a particular time frame: opening price, closing price, intraday high and low.
Horizontal levels are price coordinates, relative to which a price may stop or reverse its trajectory. In the market, these levels are called support and resistance.
Circles and rectangles are highlighted examples where the price reversed in history. This color highlighting indicates horizontal lines that may put pressure on the asset's price in the future.
The up/down arrows are landmarks of the possible price direction in the future.
Díky analytickým přehledům společnosti InstaForex získáte plné povědomi o tržních trendech! Jako zákazníkovi společnosti InstaForex je Vám k dispozici velký počet bezplatných služeb umožňujících efektivní obchodování.


