 Zůstat
Obchodní podmínky
Nástroje


Monday, as usual, was accompanied by an empty macroeconomic calendar. Important statistical data releases in the European Union, the United Kingdom, and the United States did not take place. However, in the context of the information flow, the speech of the Bank of England Deputy Governor Ben Broadbent stands out. In his statement, he emphasized the uncertainty in the UK labor market and noted that this uncertainty affects long-term decisions on inflation and possible interest rate cuts.
Broadbent particularly highlighted the volatility of wage growth data, expressing interest in whether this growth is a temporary reaction to price increases or a result of a shortage of qualified personnel. Such statements from the Bank of England raise additional questions regarding the prospective monetary policy, especially in the context of the market's expectations of interest rate cuts next year. At the same time, market participants expect a rate cut of approximately 115 basis points over the next year.

Analysis of Trading Charts from December 18
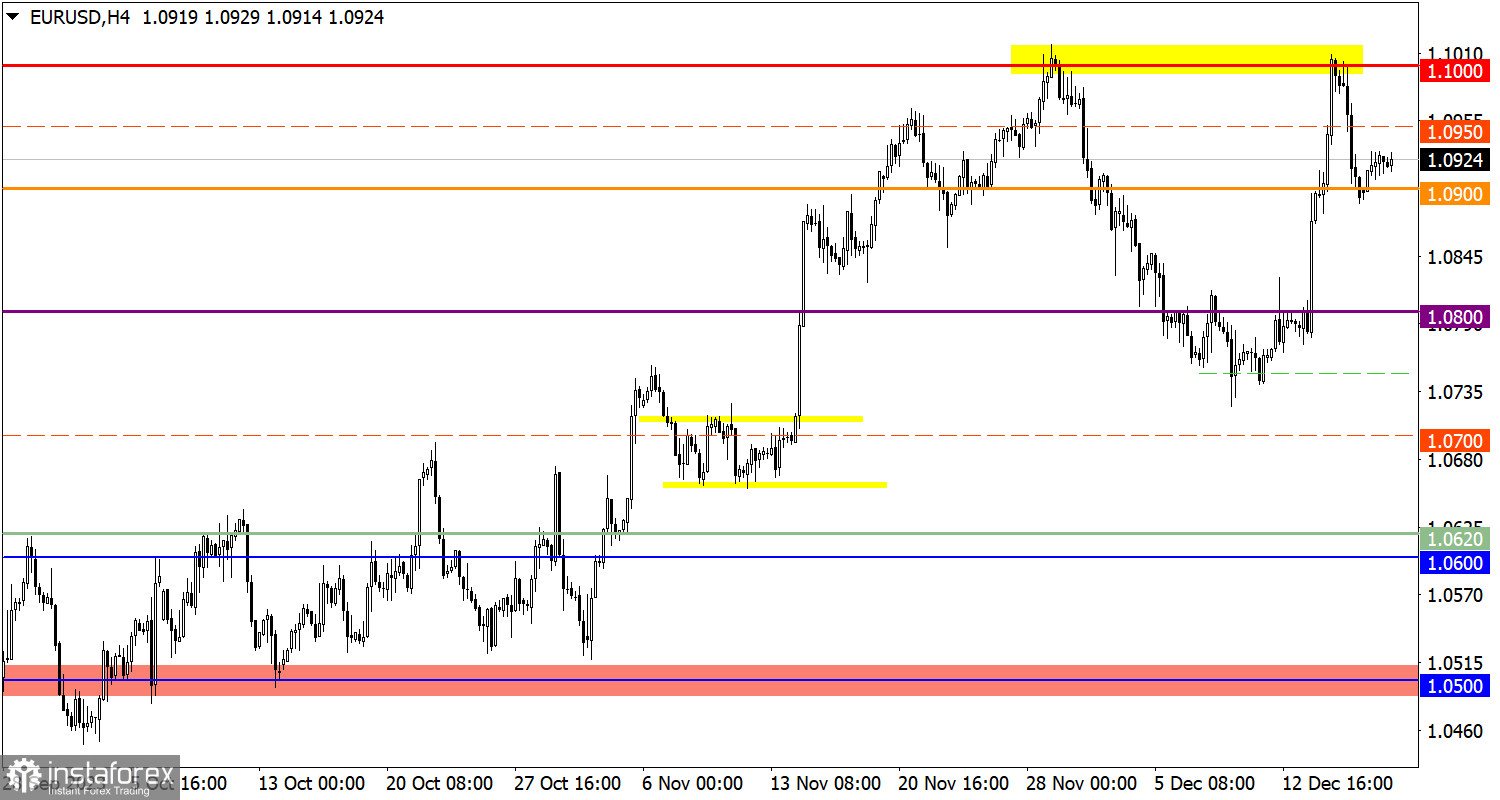
The EUR/USD currency pair moved about 100 points in a correction phase from the resistance level 1.1000. Then, a phased process of reducing short positions started around 1.0900, leading to a slowdown in the formation of the correction.
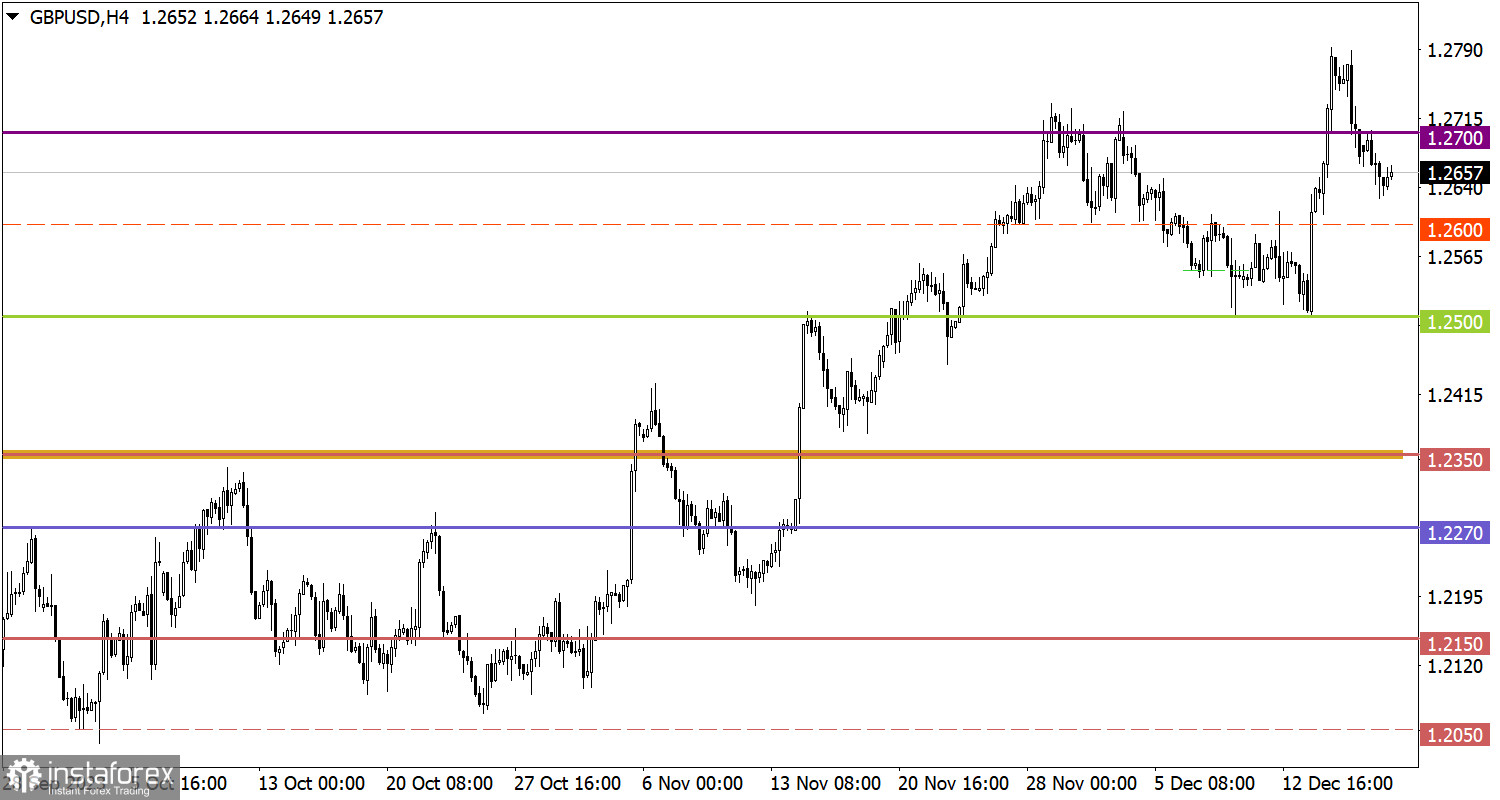
The GBP/USD pair is in a correction phase from the 1.2800 level. This caused an increase in the volume of short positions, resulting in the pound sterling losing about 1% of its value.
Economic Calendar on December 19
Today, the publication of inflation data in the Eurozone is expected, with a forecasted decrease from 2.9% to 2.4%. However, since these are final data only expected to confirm the preliminary estimate already considered in the market, the coincidence of actual and forecast values is not expected to cause a significant market reaction.
EUR/USD Trading Plan for December 19
The absence of maintaining the price below the 1.0900 level during the day may indicate the completion of the correction phase, which will subsequently lead to the recovery of the euro exchange rate. However, in case of a prolonged correction considering technical factors, the quote may well decrease to the 1.0850 level.
GBP/USD Trading Plan for December 19
The correction phase is just a tactic in the ongoing upward cycle in the market. There are no radical changes in price, so a return of the quote above the 1.2700 level may well indicate an increase in the volume of long positions. For now, the correction phase will continue to prevail among market participants for some time.
What's on the charts
The candlestick chart type is white and black graphic rectangles with lines above and below. With a detailed analysis of each individual candle, you can see its characteristics relative to a particular time frame: opening price, closing price, intraday high and low.
Horizontal levels are price coordinates, relative to which a price may stop or reverse its trajectory. In the market, these levels are called support and resistance.
Circles and rectangles are highlighted examples where the price reversed in history. This color highlighting indicates horizontal lines that may put pressure on the asset's price in the future.
The up/down arrows are landmarks of the possible price direction in the future.
Díky analytickým přehledům společnosti InstaForex získáte plné povědomi o tržních trendech! Jako zákazníkovi společnosti InstaForex je Vám k dispozici velký počet bezplatných služeb umožňujících efektivní obchodování.


