 Zůstat
Obchodní podmínky
Nástroje


Retail sales in the United Kingdom in December fell by 3.2% month-on-month, marking the largest decline in three years. This figure is the lowest since January 2021, when retail stores suffered due to the coronavirus pandemic. Year-on-year, retail sales in the country decreased by 2.4%, exceeding forecasts and the expected reduction of 1.1%.
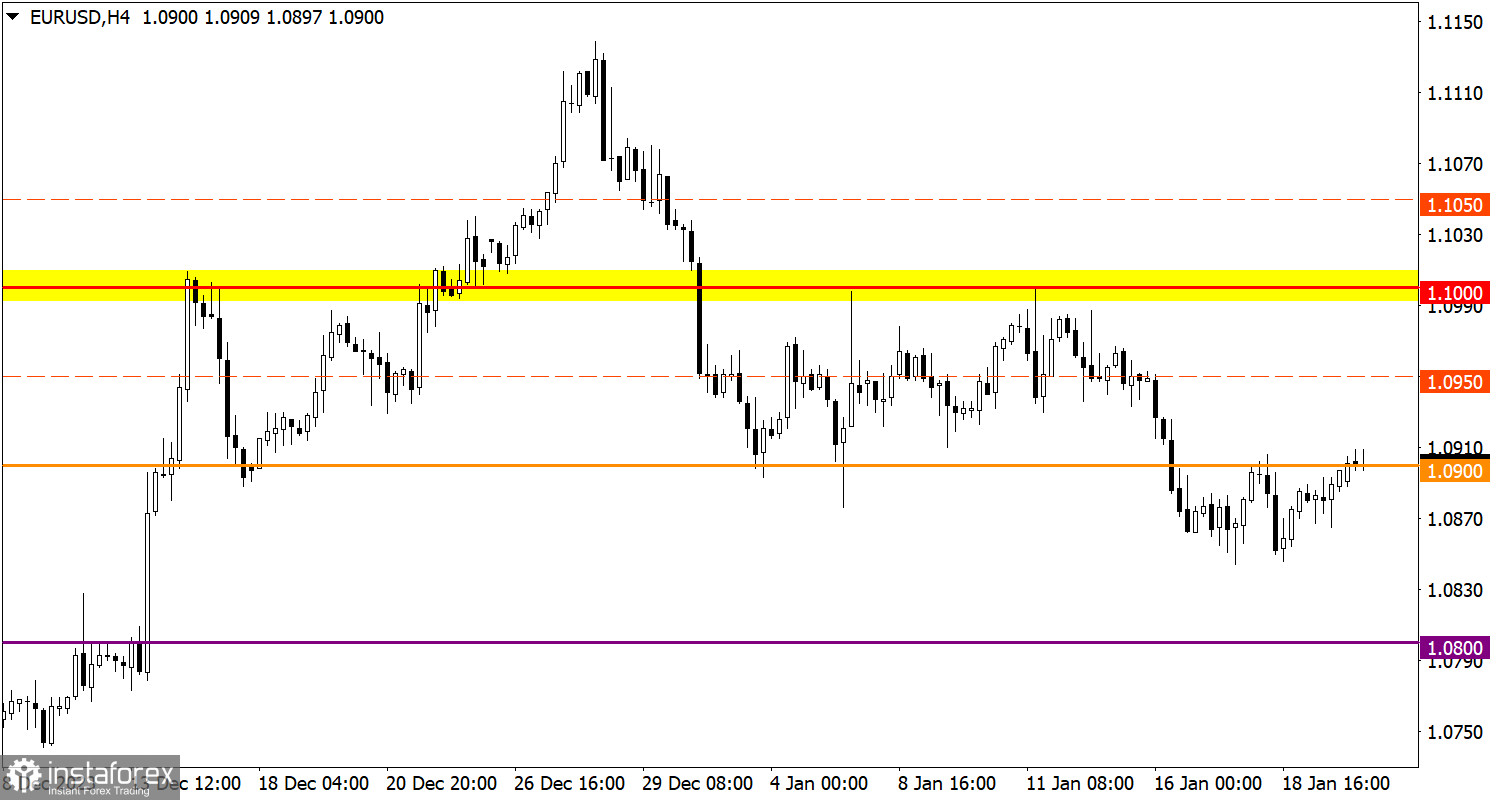
The EUR/USD currency pair returned to the 1.0900 level during its pullback, where it has experienced fluctuating movement for the second consecutive trading day.
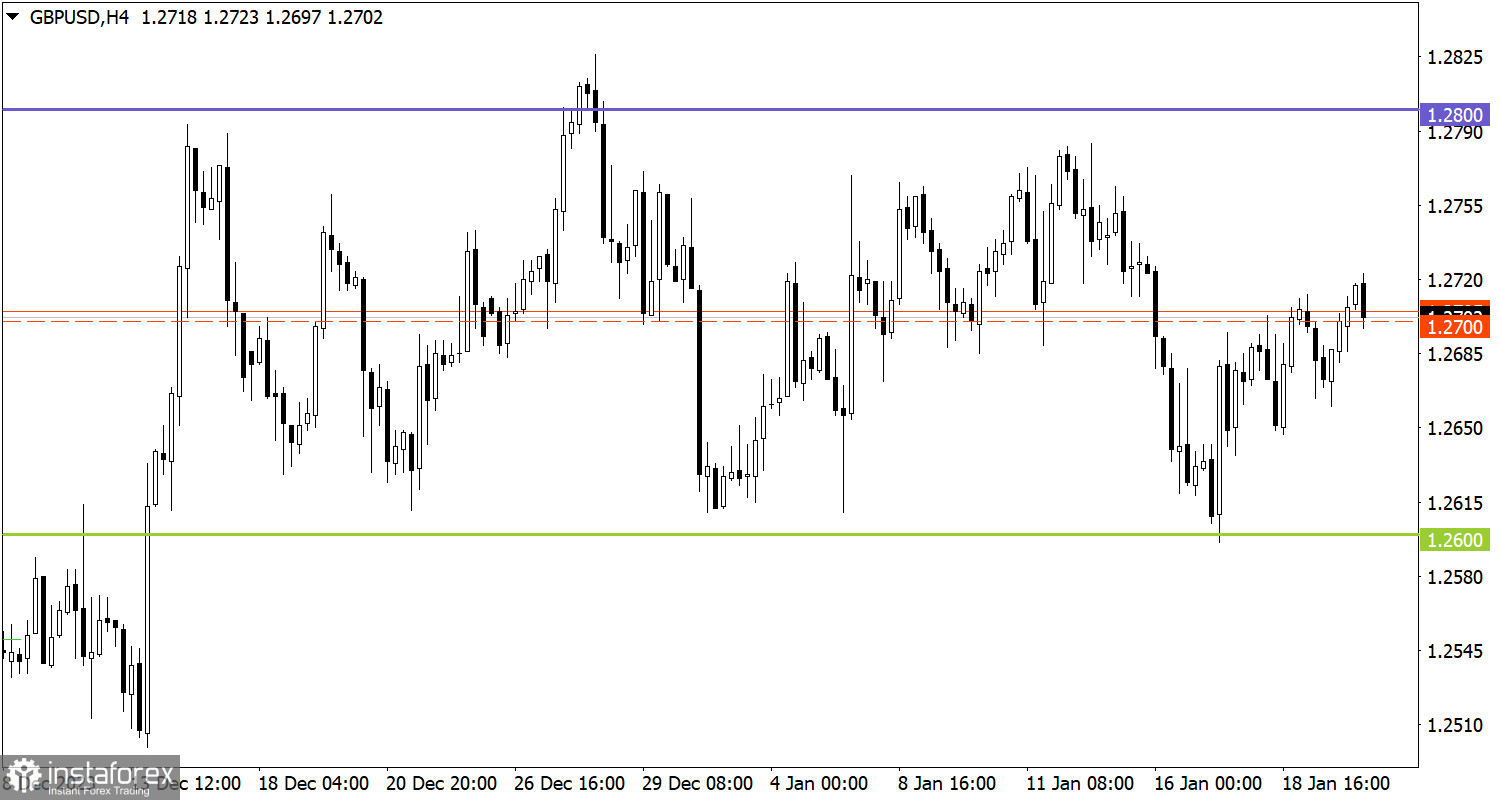
GBP/USD continues to move within a five-week sideways channel of 1.2600/1.2800, consistently testing the established boundaries. Currently, the price has stabilized above the average level of 1.2700, indicating an increase in the volume of long positions within the sideways trend.

No significant economic events are expected on Monday, and the macroeconomic calendar remains relatively empty. However, it is important to pay attention to the speech of European Central Bank President Christine Lagarde.
Statements by central bank representatives, especially their remarks regarding economic policy and forecasts, can influence financial markets. Therefore, investors and traders follow the comments and statements of key figures in the global economy to understand potential changes in long-term or short-term outlooks.
The current situation suggests that stabilization of the price above the 1.0900 level during the trading day may stimulate an increase in long positions, leading to the currency rate moving towards the 1.1000 level. On the other hand, a return of the price below 1.0850 could activate a downward scenario.
In this situation, market participants continue to focus on trading within the boundaries of the sideways channel, which apparently limits the price movement for the GBP/USD currency pair. Technical analysis indicates the possibility of the currency rate moving towards the upper boundary of the channel, located at the 1.2800 level.
However, it is important to remember that a flat is a temporary price manifestation, leading to the accumulation of trading forces and significant attention from speculators. This will eventually result in impulsive jumps that will lead to its conclusion and indicate subsequent market movement. For this reason, it is always worth considering a breakout trading tactic.
The candlestick chart type is white and black graphic rectangles with lines above and below. With a detailed analysis of each individual candle, you can see its characteristics relative to a particular time frame: opening price, closing price, intraday high and low.
Horizontal levels are price coordinates, relative to which a price may stop or reverse its trajectory. In the market, these levels are called support and resistance.
Circles and rectangles are highlighted examples where the price reversed in history. This color highlighting indicates horizontal lines that may put pressure on the asset's price in the future.
The up/down arrows are landmarks of the possible price direction in the future.
Díky analytickým přehledům společnosti InstaForex získáte plné povědomi o tržních trendech! Jako zákazníkovi společnosti InstaForex je Vám k dispozici velký počet bezplatných služeb umožňujících efektivní obchodování.


