 Zůstat
Obchodní podmínky
Nástroje


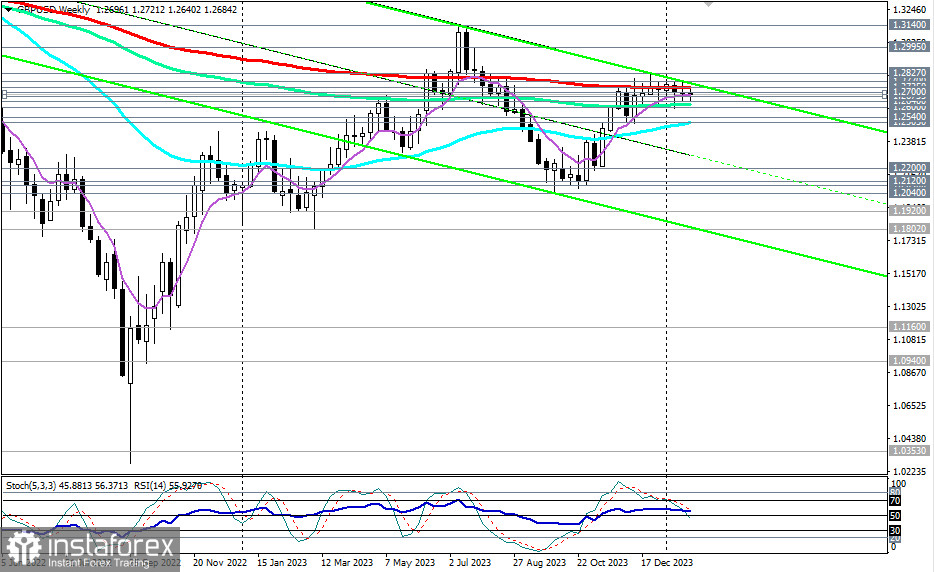
For the 8th consecutive week, GBP/USD has been testing the crucial resistance level at 1.2735 (200 EMA on the weekly chart), which separates the long-term bullish market from the bearish one.
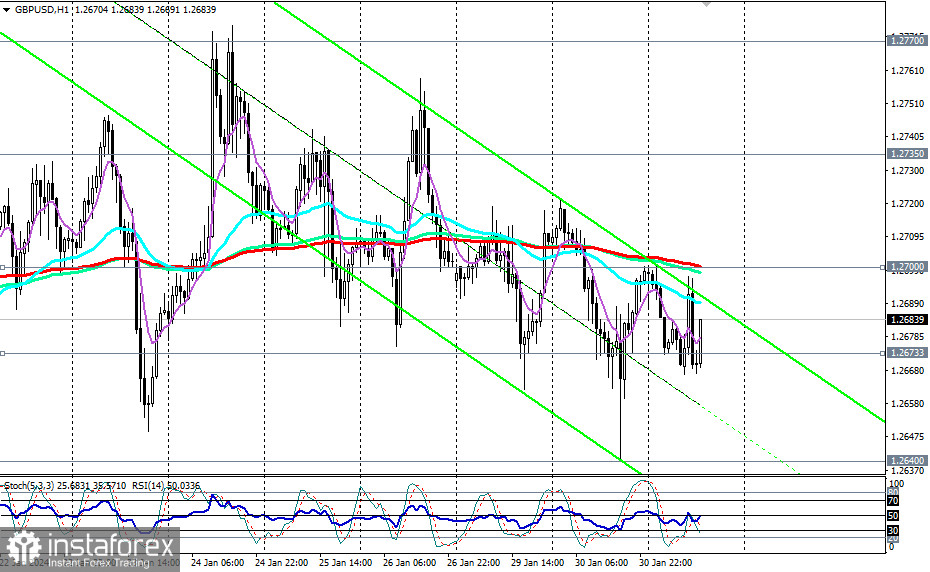
The price evidently needs new drivers, either for a break of this resistance level or a return within the downward channel on the weekly chart and subsequent decline. Signals for implementing the bearish scenario could be a breakdown of support levels at 1.2673 (200 EMA on the 4-hour chart) and 1.2640 (50 EMA on the daily chart and the lower boundary of the range established between the levels 1.2640 and 1.2735).
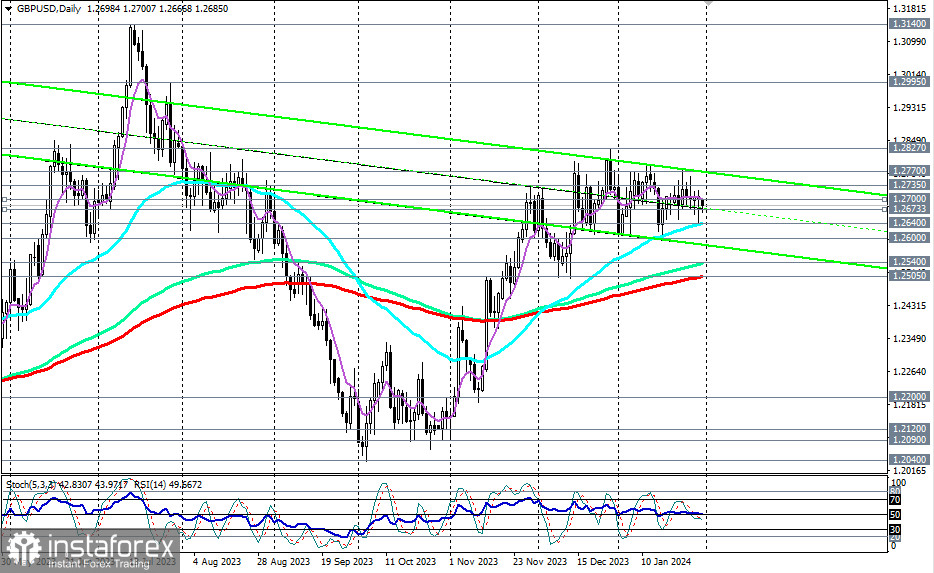
A broader range is located between the levels of 1.2770 (50 EMA on the monthly chart) and 1.2600. GBP/USD has been trading in this range since mid-December 2023.
A break of its lower boundary may trigger a deeper decline, down to key support levels at 1.2540 (144 EMA on the daily chart) and 1.2505 (200 EMA on the daily chart).
Their breakdown, in turn, will lead GBP/USD into the zone of the medium-term bearish market. In case of further decline, GBP/USD will head into the depths of the downward channel on the weekly chart, the lower boundary of which passes near local support levels of 1.1920 and 1.1800.
In an alternative scenario, the price will overcome the zone of key resistance levels at 1.2735 (200 EMA on the weekly chart), 1.2770 (50 EMA on the monthly chart) and move towards the upper boundary of the broad range mentioned above and the high of 2023, reached in December at 1.2827, with the prospect of further growth. This, in turn, will mean GBP/USD entering the zone of the long-term bullish market, making long-term long positions relevant.
The first signal to implement this scenario could be the breakout of the resistance level at 1.2700 (200 EMA on the 1-hour chart).
Support levels: 1.2673, 1.2640, 1.2600, 1.2540, 1.2505, 1.2500
Resistance levels: 1.2700, 1.2735, 1.2770, 1.2800, 1.2827, 1.2900, 1.2995, 1.3100, 1.3140, 1.3200
Trading Scenarios
Main Scenario: Sell Stop 1.2660. Stop-Loss 1.2720. Targets 1.2640, 1.2600, 1.2540, 1.2505, 1.2500, 1.2480, 1.2400
Alternative Scenario: Buy Stop 1.2720. Stop-Loss 1.2660. Targets 1.2735, 1.2770, 1.2800, 1.2827, 1.2900, 1.2995, 1.3100, 1.3140, 1.3200
"Targets" correspond to support/resistance levels. This also does not mean that they will necessarily be reached but can serve as a guide in planning and placing your trading positions.
Díky analytickým přehledům společnosti InstaForex získáte plné povědomi o tržních trendech! Jako zákazníkovi společnosti InstaForex je Vám k dispozici velký počet bezplatných služeb umožňujících efektivní obchodování.


