 Zůstat
Obchodní podmínky
Nástroje


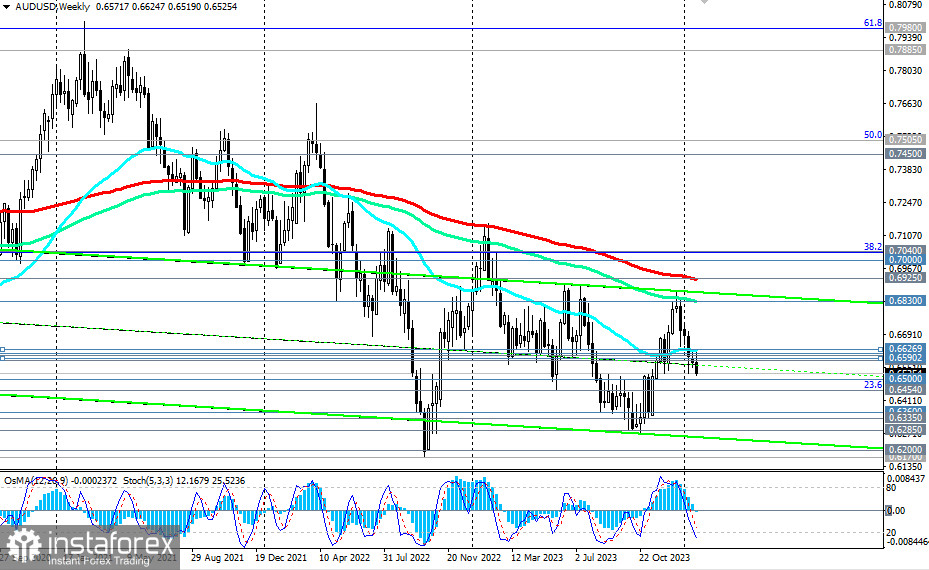
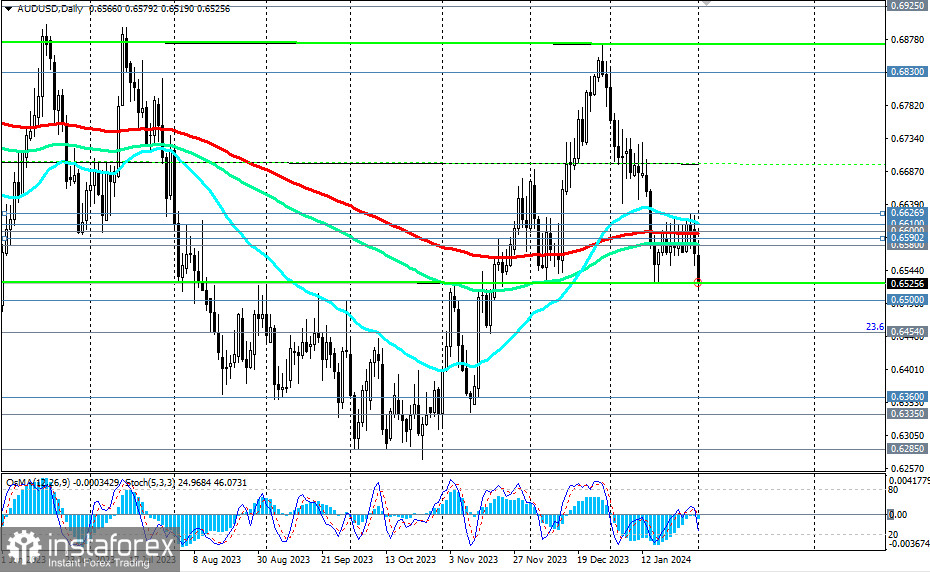
After breaking through the key support level of 0.6600 (200 EMA on the daily chart) on Wednesday, AUD/USD continues to decline and deepens into the medium-term bearish market zone. At the same time, the pair remains in the long-term bearish market zone, below the key long-term resistance levels of 0.6830 (144 EMA on the weekly chart) and 0.6925 (200 EMA on the weekly chart).
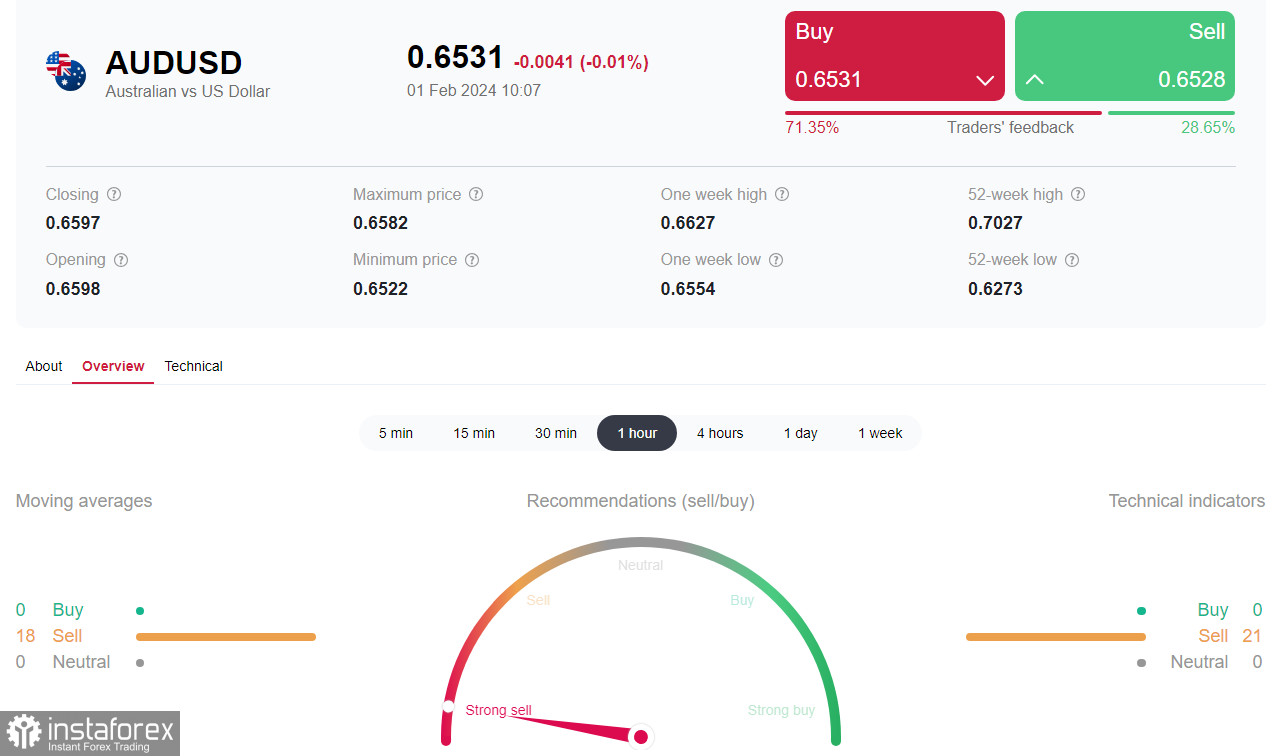
Technical indicators OsMA and Stochastic on 4-hour, daily, and weekly charts also favor sellers.
In the case of further decline, the nearest targets for the pair will be the local support level of 0.6500 and the support level of 0.6454 (23.6% Fibonacci retracement level in the downward wave from the level of 0.9500 to the level of 0.5510), while more distant targets include local lows near the 0.6300 mark.
In an alternative scenario, if AUD/USD breaks the key medium-term resistance level of 0.6600, it may continue to rise toward the key long-term resistance level of 0.6925 (200 EMA on the weekly chart). A break above the said level and 0.7000 mark would take AUD/USD into the long-term bullish market zone with the prospect of growth to important resistance levels of 0.7400 (200 EMA on the monthly chart) and 0.7505 (50.0% Fibonacci level). Their breakout, in turn, would take AUD/USD into the global bullish market zone.
The first signal to implement this scenario is the breakout of the resistance level 0.6580 (144 EMA on the daily chart).
Support levels: 0.6500, 0.6454, 0.6400, 0.6360, 0.6335, 0.6300, 0.6285, 0.6200, 0.6170
Resistance levels: 0.6580, 0.6590, 0.6600, 0.6610, 0.6627, 0.6700, 0.6800, 0.6830, 0.6900, 0.6925, 0.7000, 0.7040
Trading Scenarios:
Main Scenario: Sell at the market, Sell Stop 0.6490. Stop-Loss 0.6560. Targets 0.6450, 0.6400, 0.6360, 0.6335, 0.6300, 0.6285, 0.6200, 0.6170
Alternative Scenario: Buy Stop 0.6560. Stop-Loss 0.6520. Targets 0.6580, 0.6590, 0.6600, 0.6610, 0.6627, 0.6700, 0.6800, 0.6830, 0.6900, 0.6925, 0.7000, 0.7040
"Targets" correspond to support/resistance levels. This does not necessarily mean that they will be reached, but they can serve as a guide when planning and placing your trading positions.
Díky analytickým přehledům společnosti InstaForex získáte plné povědomi o tržních trendech! Jako zákazníkovi společnosti InstaForex je Vám k dispozici velký počet bezplatných služeb umožňujících efektivní obchodování.


