 Zůstat
Obchodní podmínky
Nástroje


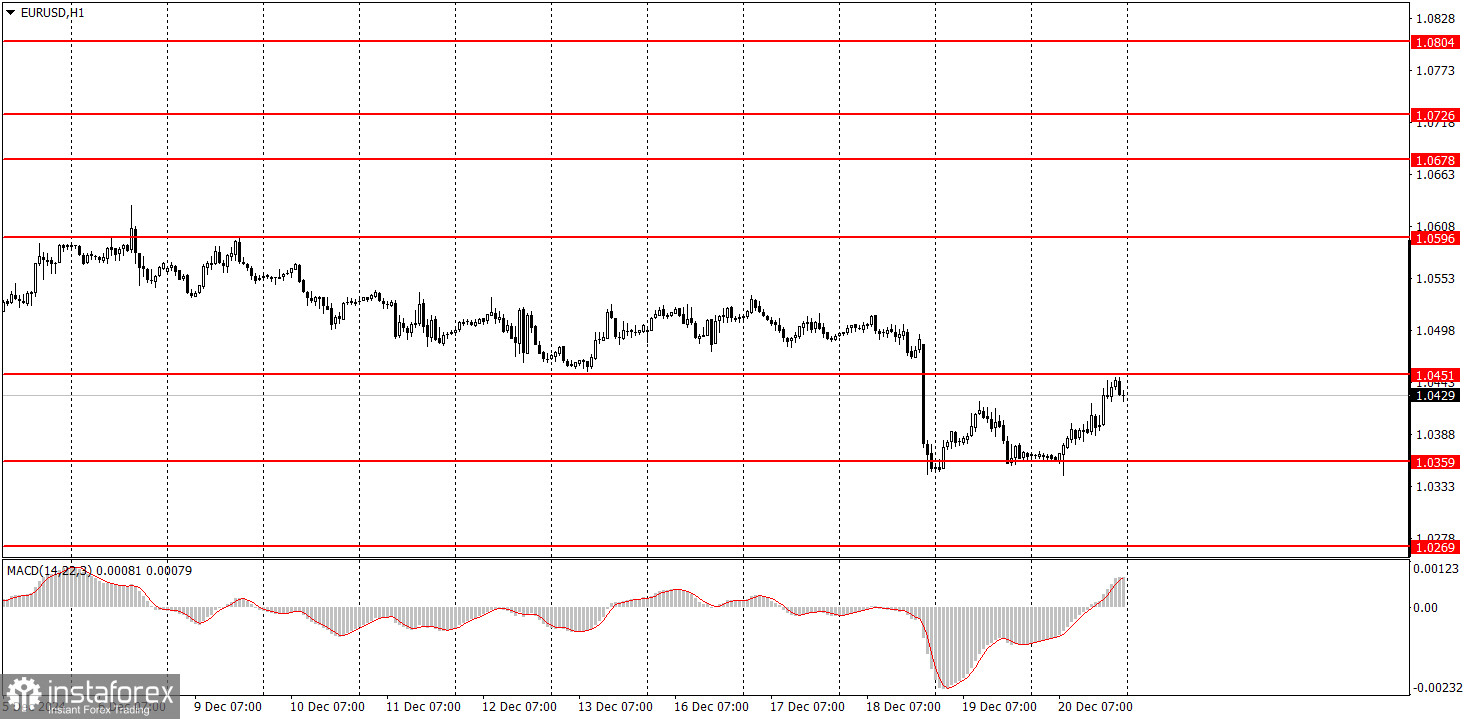
On Friday, the EUR/USD currency pair traded with an upward bias throughout the day. Despite the absence of significant events in the morning, the euro started to rise as soon as trading began. As shown in the chart above, the pair's upward movement on Friday almost mirrored the decline it experienced on Wednesday evening despite no strong macroeconomic support.
We view this movement as illogical and purely technical. The price approached the 1.0359 level for the third time but failed to break through it once again. Similarly, the 1.0451 level now acts as a ceiling, preventing further growth. If the price remains below this resistance, it could attempt another breakout of 1.0359 next week. As mentioned, we still believe the US dollar is poised to strengthen.
The most notable reports on Friday were the PCE Index and the University of Michigan Consumer Sentiment Index. However, neither report delivered significant results to justify the dollar's near 100-pip decline.
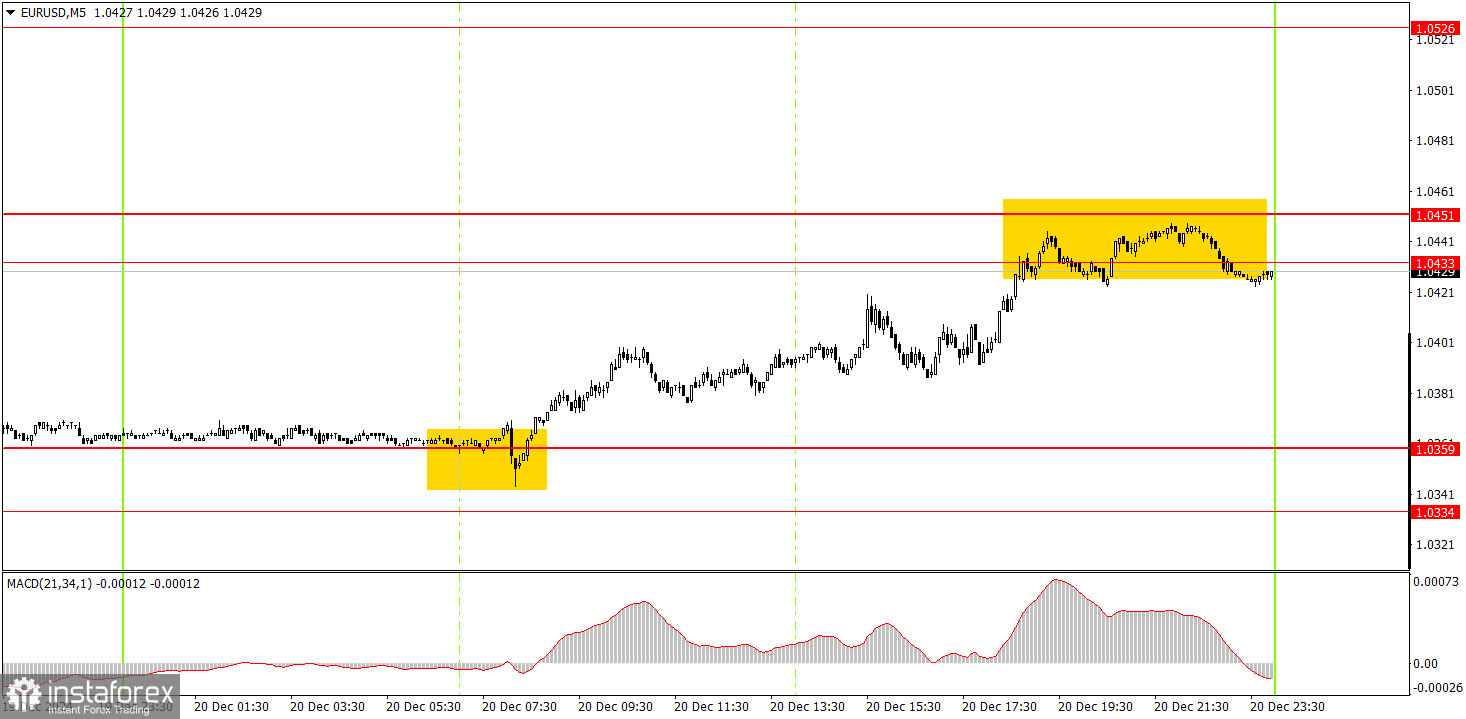
On the 5-minute timeframe, Friday produced a strong buy signal around the 1.0334-1.0359 area despite no macroeconomic justification for such a movement. Nevertheless, novice traders could have acted on this signal, and by the end of the day, the price reached the 1.0433-1.0451 area, where profits could have been locked in.
In the hourly timeframe, EUR/USD had been trading in a range of nearly three weeks. However, the FOMC meeting results triggered a strong market reaction that ended the flat phase. We believe the euro's decline will resume. Over the upcoming holiday weeks, the market could enter a new flat or corrective phase.
On Monday, the pair may rebound from the 1.0451 level and erase Friday's illogical gains by returning to 1.0359. Therefore, sell signals near the 1.0433-1.0451 area should be taken seriously.
On the 5-minute TF, the levels of 1.0269-1.0277, 1.0334-1.0359, 1.0433-1.0451, 1.0526, 1.0596, 1.0678, 1.0726-1.0733, 1.0797-1.0804, 1.0845-1.0851, 1.0888-1.0896 should be considered. No significant events are scheduled for Monday in the Eurozone or the US. As a result, low volatility is likely, and trading will likely rely solely on technical signals.
Support and Resistance Levels: These are target levels for opening or closing positions and can also serve as points for placing Take Profit orders.
Red Lines: Channels or trendlines indicating the current trend and the preferred direction for trading.
MACD Indicator (14,22,3): A histogram and signal line used as a supplementary source of trading signals.
Important Events and Reports: Found in the economic calendar, these can heavily influence price movements. Exercise caution or exit the market during their release to avoid sharp reversals.
Forex trading beginners should remember that not every trade will be profitable. Developing a clear strategy and practicing proper money management are essential for long-term trading success.
Díky analytickým přehledům společnosti InstaForex získáte plné povědomi o tržních trendech! Jako zákazníkovi společnosti InstaForex je Vám k dispozici velký počet bezplatných služeb umožňujících efektivní obchodování.


