 Zůstat
Obchodní podmínky
Nástroje


In my morning forecast, I highlighted the 1.1412 level and planned to make trading decisions from there. Let's take a look at the 5-minute chart and analyze what happened. The rise and formation of a false breakout near 1.1412 provided a good entry point for selling the euro; however, the pair failed to see a significant decline. The technical outlook for the second half of the day has not changed substantially.
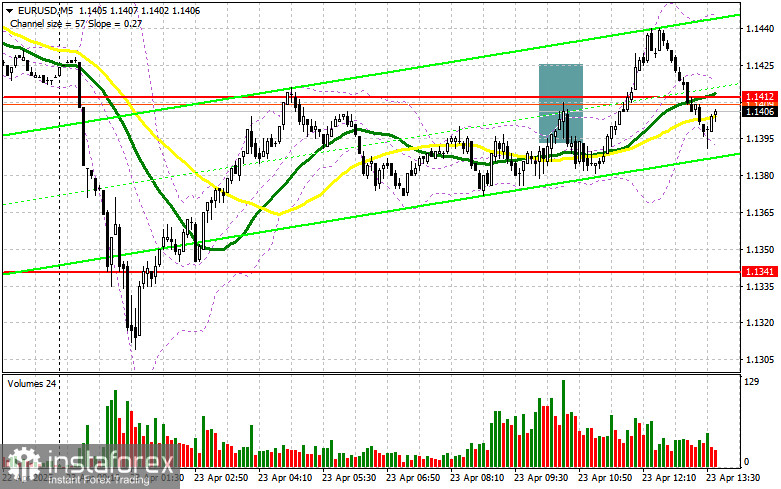
Weak PMI data from Eurozone countries had little impact on the euro, which has recently been rising due to the US trade war with much of the world. In the second half of the day, similar data will be released for the US. Only strong US Manufacturing and Services PMI data could put pressure back on the euro and support the dollar. Otherwise, the market is likely to continue trading within a sideways channel, favoring further EUR/USD gains.
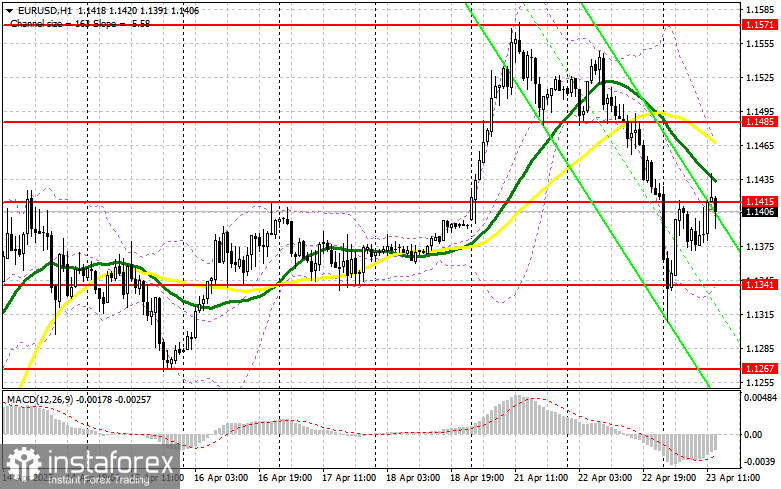
I plan to act as low as possible. If the pair declines, only a false breakout around the 1.1341 support level will be a reason to buy EUR/USD in anticipation of a continued bullish market, with a potential move toward 1.1415, where the pair is currently trading. A breakout and retest of this range from above will confirm a valid buy entry with a further target of 1.1485. The ultimate target will be 1.1571, where I plan to take profit.
If EUR/USD declines and shows no activity near 1.1341 in the second half of the day, pressure on the pair will increase significantly, potentially leading to a larger correction. In that case, bears could push the price down to 1.1267. Only after a false breakout forms at that level will I consider buying the euro. Alternatively, I will open long positions on a rebound from 1.1206, aiming for a 30–35 point intraday correction.
If the euro rises again following US data, bears will need to assert themselves around 1.1415. Only a false breakout at this level will serve as a signal to enter short positions, targeting the 1.1341 support. A breakout and consolidation below this range would be a good setup for selling, aiming for 1.1267—a fairly substantial correction. The ultimate target will be 1.1206, where I plan to take profit. A test of this level would signal a breakdown of the bullish trend.
If EUR/USD rises in the second half of the day and bears fail to show strength around 1.1415—where the moving averages are also located and favor sellers—buyers may push the pair to a new high at 1.1485. I will only consider selling there after an unsuccessful consolidation. I plan to open short positions on a rebound from 1.1571, aiming for a 30–35 point downward correction.
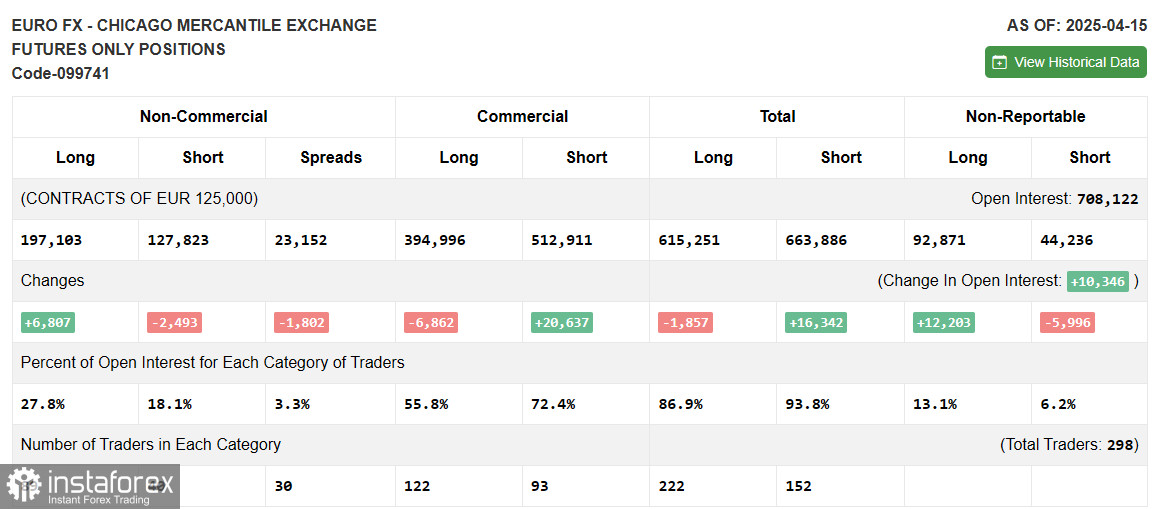
The COT report showed an increase in long positions and a decrease in short ones. Given the lack of a trade deal between the European Union and the US, the euro continues to strengthen while the dollar weakens. Possible market turmoil due to Trump's attempt to remove Jerome Powell as Fed Chair is also putting pressure on the dollar. The report indicates that long non-commercial positions rose by 6,807 to 197,103, while short non-commercial positions fell by 2,493 to 127,823. As a result, the gap between long and short positions narrowed by 2,493.
Moving Averages Trading is occurring below the 30- and 50-day moving averages, indicating a possible decline in the pair.
Note: The periods and prices of the moving averages are considered by the author on the H1 chart and may differ from the classic daily moving averages on the D1 chart.
Bollinger Bands In the event of a decline, the lower boundary of the indicator around 1.1341 will act as support.
Díky analytickým přehledům společnosti InstaForex získáte plné povědomi o tržních trendech! Jako zákazníkovi společnosti InstaForex je Vám k dispozici velký počet bezplatných služeb umožňujících efektivní obchodování.


