 Zůstat
Obchodní podmínky
Nástroje


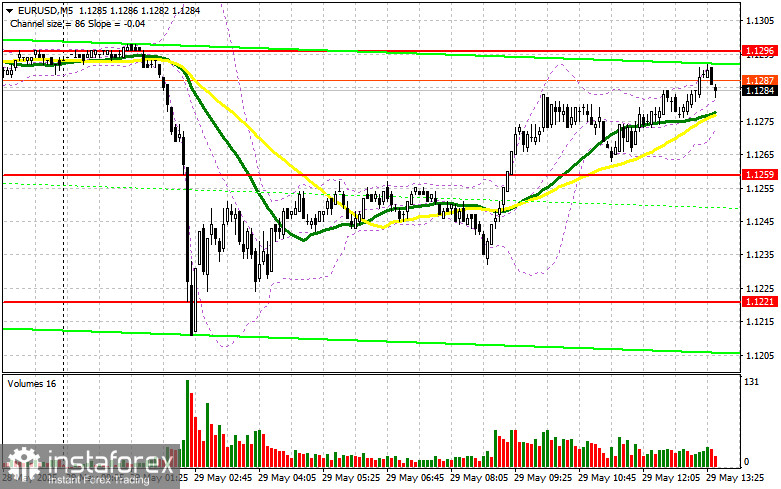
In my morning forecast, I focused on the 1.1259 level and planned to make trading decisions based on it. Let's look at the 5-minute chart to understand what happened there. Although the price increased, there was no false breakout formation at that level, so I remained out of the market. The technical outlook was revised for the second half of the day.
As expected, the lack of significant fundamental data from the eurozone helped the euro recover its position in the first half of the day. However, further movement will depend entirely on U.S. data. We await figures on Q1 GDP changes, initial jobless claims, and pending home sales. FOMC members Adriana D. Kugler and Austan D. Goolsbee are also scheduled to speak. Strong U.S. data could renew demand for the dollar and drive EUR/USD down — an opportunity I plan to use.
The focus will be on defending the 1.1256 support level, tested earlier in the day. A false breakout at this level will be a signal to buy EUR/USD in anticipation of a market rebound toward 1.1296. A breakout and retest of that level from above will confirm a correct entry point, opening the path to 1.1336. The final target will be 1.1374, where I plan to take profit. If EUR/USD declines and there is no activity around 1.1256, the pair may face stronger pressure, pushing it down to 1.1214. I will only consider buying after a false breakout at that level. Otherwise, I will open long positions on a rebound from 1.1174 targeting a 30–35 point intraday correction.
Sellers failed to show any activity, which is surprising after the significant Asian sell-off. If U.S. data disappoints and the market reacts bullishly, I'll wait for a false breakout at 1.1296 — where moving averages are reinforcing resistance — before selling. This will provide a valid short entry point targeting the 1.1256 support level. A breakout and consolidation below this zone will provide another selling opportunity targeting 1.1214. The final bearish target will be 1.1174, where I will take profit.
If EUR/USD rises in the second half of the day and bears do not act around 1.1296, bulls could push the pair higher to test 1.1336. I will only sell there after a failed consolidation. If there's no downward move there either, I will look for short entries around 1.1374, but only for an intraday correction of 30–35 points.
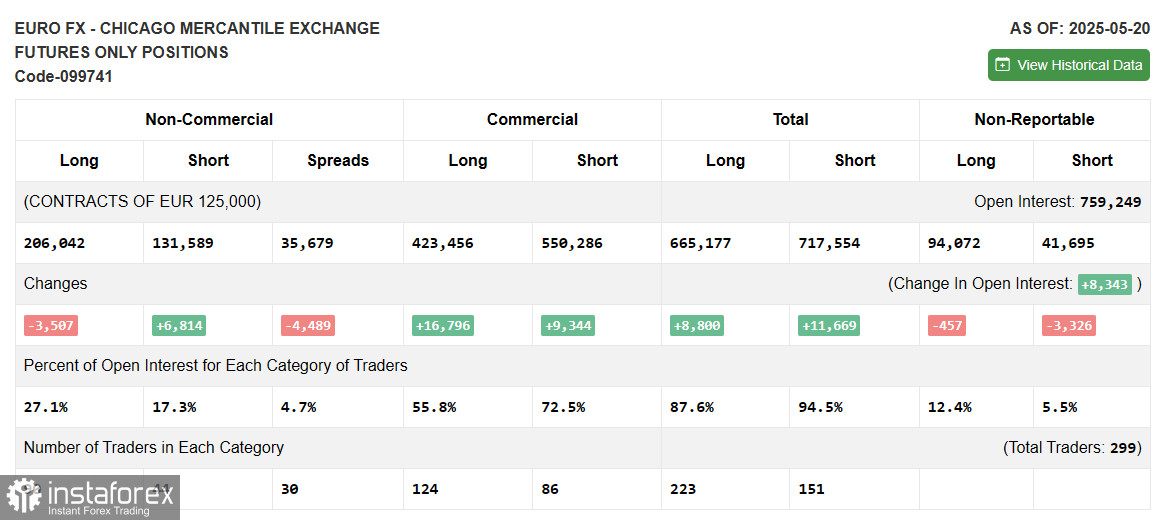
COT Report (Commitments of Traders) – May 20:
The COT report showed an increase in short positions and a decrease in long ones. The EU's active efforts to negotiate a trade deal with the U.S. — even leading to a postponement of higher tariffs until July — suggest a solid near-term outlook for the euro. Combined with the Fed's dovish stance, this weakens the dollar's upward potential. According to the report, long non-commercial positions dropped by 3,507 to 206,042, while short non-commercial positions increased by 6,814 to 131,589. This reduced the net long/short gap by 4,489.
Indicator Signals:
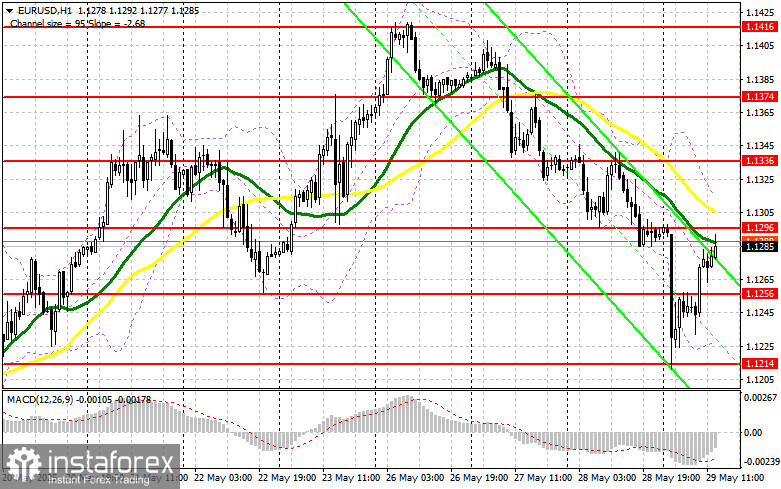
Moving Averages: Trading is below the 30- and 50-period MAs, indicating continued downside pressure.Note: Periods and prices of MAs are considered on the H1 chart and differ from classical D1 averages.
Bollinger Bands: In case of a decline, the lower band around 1.1230 will serve as support.
Indicator Descriptions:
Díky analytickým přehledům společnosti InstaForex získáte plné povědomi o tržních trendech! Jako zákazníkovi společnosti InstaForex je Vám k dispozici velký počet bezplatných služeb umožňujících efektivní obchodování.


