 Zůstat
Obchodní podmínky
Nástroje


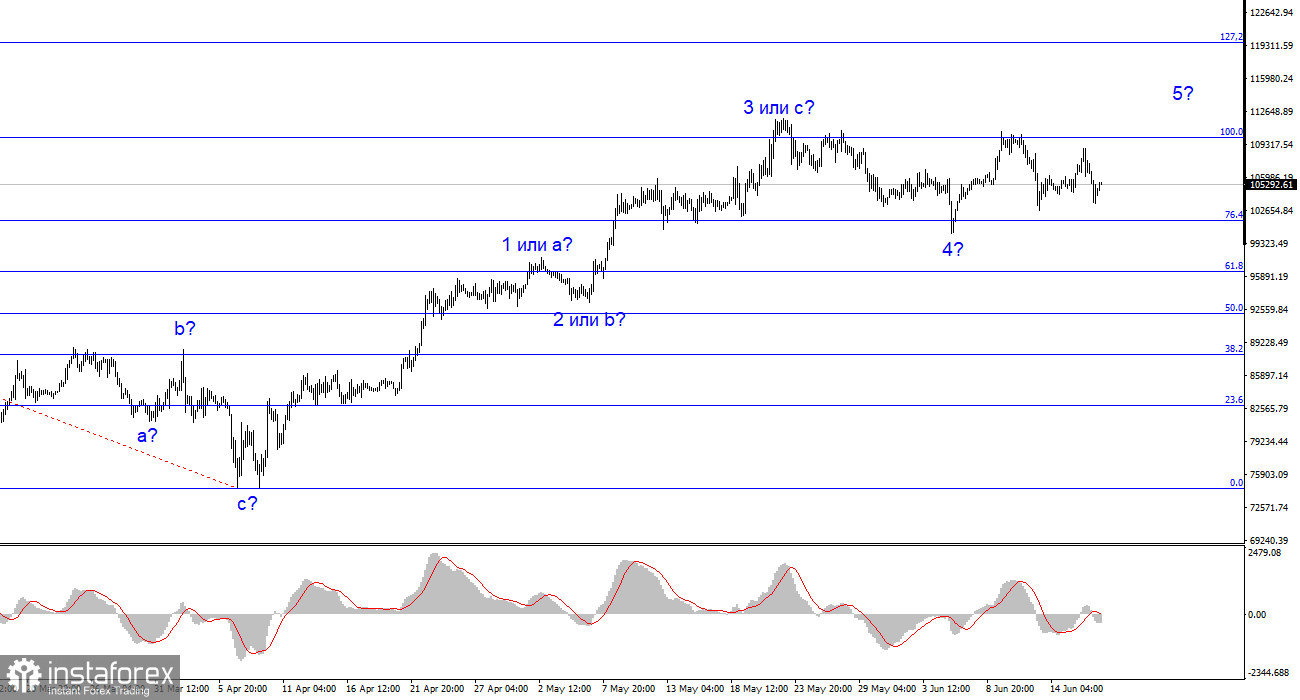
The wave pattern on the 4-hour chart of BTC/USD has become more complicated in recent months. We observed a corrective downward structure that completed near the $75,000 mark. After that, a rather strong upward movement began, which may be viewed as an impulsive bullish trend. The second wave in this segment appeared tiny and unconvincing. Therefore, I consider the current section to be impulsive in nature. If this assumption is correct, the trend still lacks a convincing wave 5, the peak of which should surpass the peak of wave 3. Based on this, I expect one more final upward impulse. A successful breakout through the 100.0% Fibonacci level would indicate a continuation of the bullish leg, which could potentially extend further under certain circumstances.
Market sentiment is driving Bitcoin, but fundamentals are inconsistent
The news backdrop occasionally supports Bitcoin, but not consistently. I would argue that market participants tend to interpret any news in favor of the leading cryptocurrency, or simply ignore the news altogether and keep buying. What we're witnessing is the development of an upward trend driven by emotion, demand, and belief in Bitcoin's sky-high future value. The rally from $75,000 to $111,000 exhibits all the classic signs of a "pump." But when a pump ends, decline begins.
The explanation is simple
BTC/USD has rallied considerably over the past two and a half months. Buyers only began facing resistance near the 100.0% Fibonacci level. Three failed attempts to break through this mark suggest the market is primed for another corrective wave. However, I still expect to see a more convincing wave 5 afterwards. Wave 5 could even extend further, but that can only be confirmed after a successful breakout beyond $110,000.
The news backdrop plays a relatively minor role in Bitcoin's development. I don't see any significant changes in recent weeks that would explain a drop in demand for Bitcoin. However, notably, the S&P 500 index has also struggled to rise recently. It seems that the leading instruments in both the US crypto and stock markets rebounded quickly after the first months of Donald Trump's return, but now lack a clear narrative for continued growth. I still believe the drop in February–March won't be the only one in 2025.
Geopolitical pressures intensify, but Bitcoin faces a technical ceiling
Tensions in the Middle East have escalated in recent weeks, while Donald Trump continues to pressure China and the European Union. As recently as yesterday, he renewed criticism toward Brussels, lamenting the EU's failure to offer a fair trade deal. Thus, US–EU trade negotiations remain stalled, and talks with Beijing show little progress or momentum. Still, these developments are not what stopped Bitcoin; rather, it was the $110,000 level.
Based on my analysis of BTC/USD, the bullish wave structure continues to develop, though it has a peculiar nature and shaky foundation. The recent price surge was not driven by strong fundamental news, and the $110,000 mark has halted bullish momentum for the fourth time in a row. Setting aside wave theory, one could argue that a new downward trend segment is forming. Accordingly, we may soon see at least a corrective wave targeting below the $100,200 mark. At the same time, we have yet to witness a convincing wave 5.
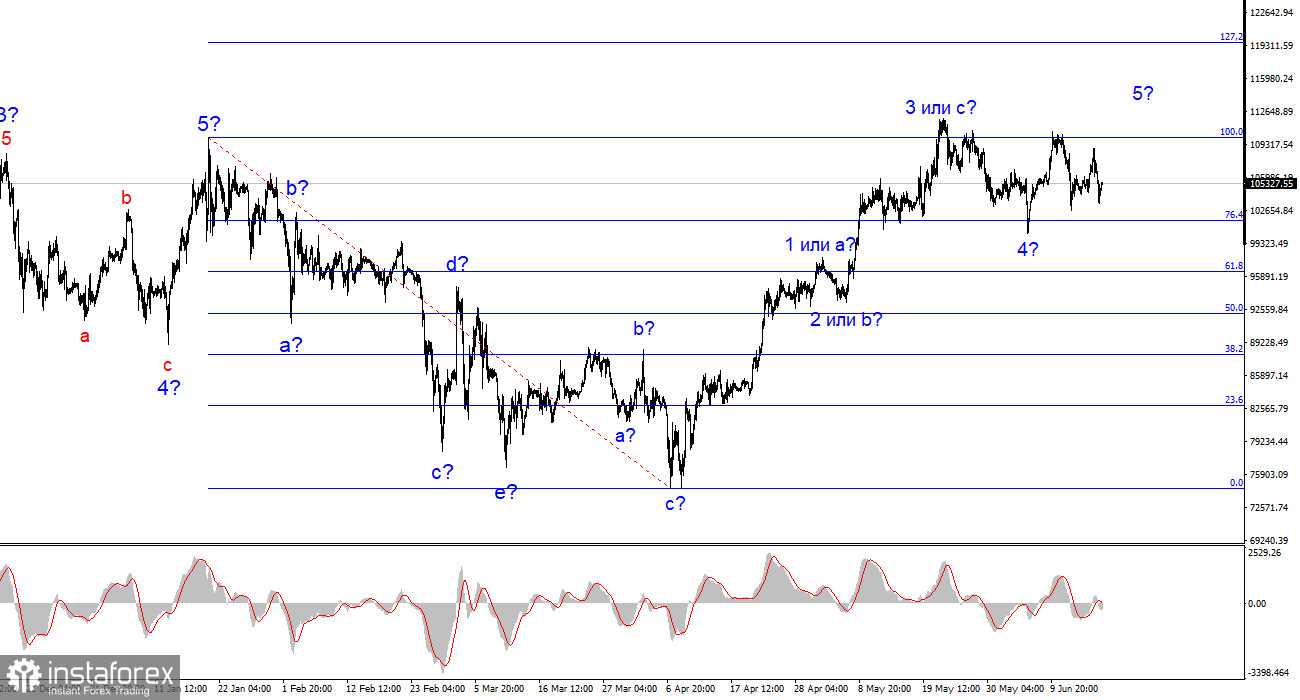
On a larger wave scale, the bullish trend segment is still unfolding, but its internal structure remains ambiguous due to the virtual absence of corrective waves.
Key principles of my wave analysis:
Díky analytickým přehledům společnosti InstaForex získáte plné povědomi o tržních trendech! Jako zákazníkovi společnosti InstaForex je Vám k dispozici velký počet bezplatných služeb umožňujících efektivní obchodování.


