 Zůstat
Obchodní podmínky
Nástroje



The daily chart for the EUR/USD pair reveals a sharp bearish shift in price action; the pair is currently trading at 1.1490 after exiting its ascending price channel and breaking through pivotal support levels.
Technical Outlook and Price Action
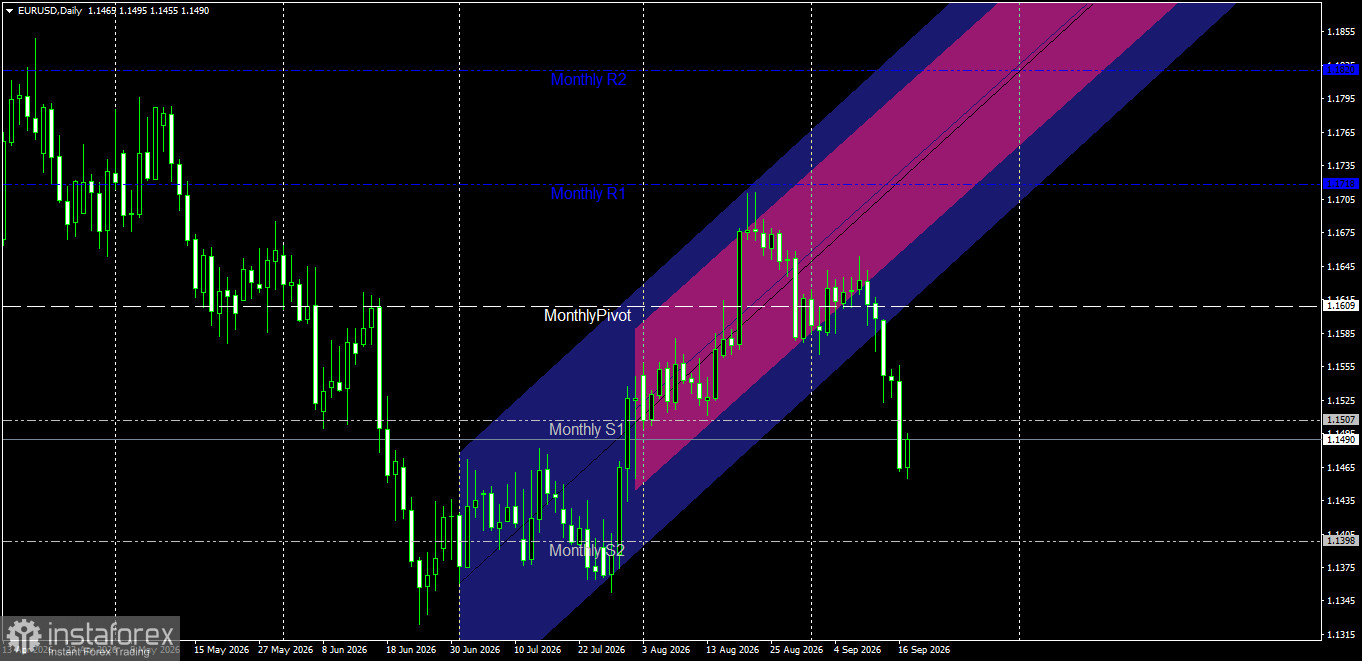
Break of Overlapping Price Channels: The pair initially moved within a primary rising channel (blue) and a steeper secondary rising channel (red). Intense selling pressure drove the price sharply below the boundaries of both rising channels, shifting it into a rapidly descending channel.
Break of Weekly Pivot Levels: The decline began by breaking the Weekly Pivot level at 1.1607 and the first resistance level (Weekly R1) at 1.1645. It continued its accelerated drop, breaching the first weekly support (Weekly S1) at 1.1560 and subsequently the second weekly support (Weekly S2) at 1.1522.
Rebound from Weekly S3: The price established a local low near the 1.1460–1.1445 range—close to the third weekly support (Weekly S3) at 1.1475—with the chart showing a mild corrective rebound currently stabilizing around 1.1490.
Key Support and Resistance Levels
Key Resistance Levels:
Resistance 1: 1.1522 level (the broken Weekly S2, which has now turned into resistance).
Resistance 2: 1.1560 level (Weekly S1 and the lower boundary of the broken channel). Pivot Resistance: 1.1607 (Weekly Pivot).
Key Support Levels:
First Support: 1.1475 (Weekly S3).
Second Support: Current low at 1.1445.
Target Support: Key psychological level at 1.1400.
Price Action Outlook and Trading Scenarios
Bearish Scenario (Primary):
A bearish trajectory is the most likely outcome, driven by persistent selling momentum following the break of ascending channels and the price stabilizing below Pivot lines.
Validation Condition: Sustained trading below the 1.1522–1.1560 resistance zone.
Technical Targets: Continued decline targeting a retest of the 1.1445 low (first target); a break below this level opens the way for a drop toward 1.1400.
Stop Loss: A 4-hour candle close above 1.1565.
Bullish Corrective Scenario (Alternative):
The price may attempt a temporary bullish rebound to retest broken levels, as momentum reaches oversold territory near Weekly S3.
Validation Condition: Breaking above 1.1522 and holding there with a full 4-hour candle.
Technical Targets: Retesting the 1.1560 resistance level before downward pressure resumes.
Díky analytickým přehledům společnosti InstaForex získáte plné povědomi o tržních trendech! Jako zákazníkovi společnosti InstaForex je Vám k dispozici velký počet bezplatných služeb umožňujících efektivní obchodování.


