 Zůstat
Obchodní podmínky
Nástroje


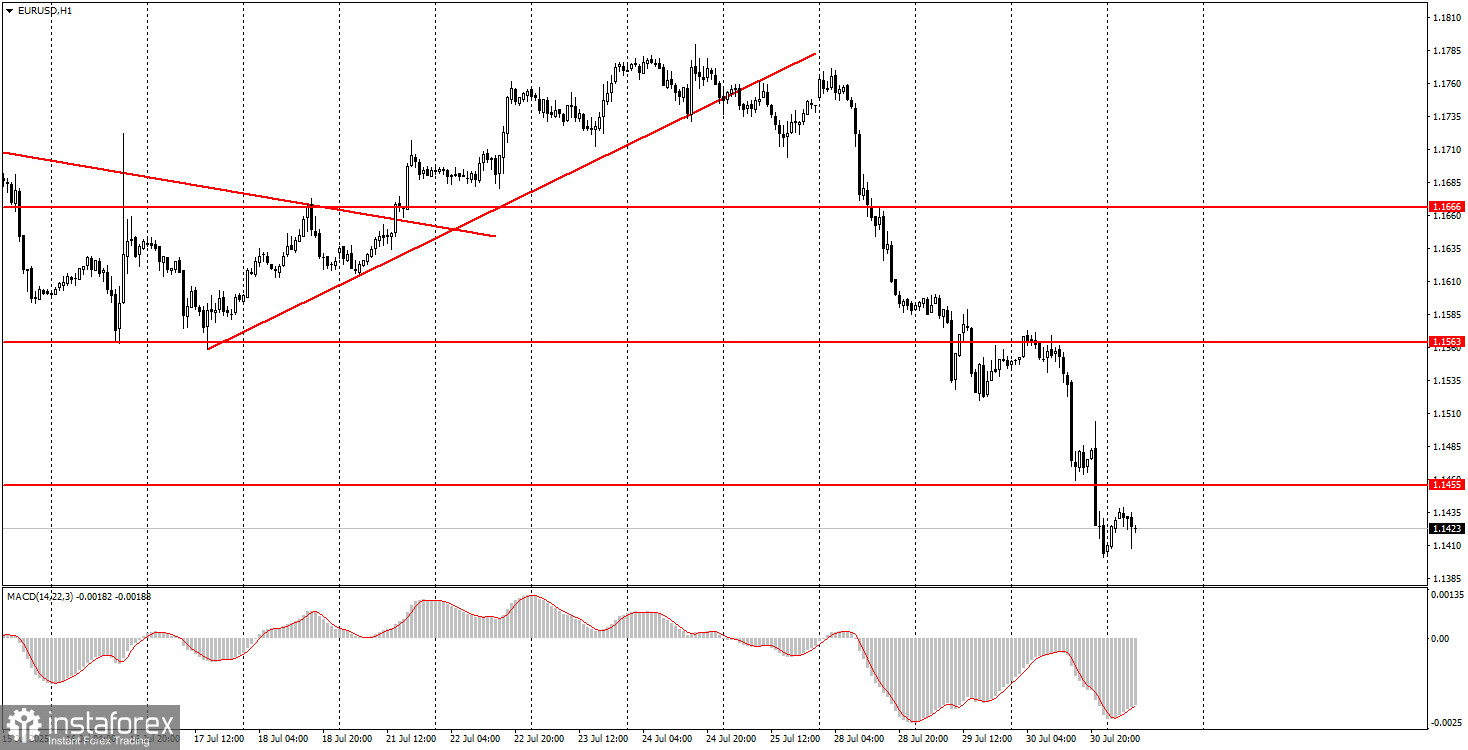
On Wednesday, the EUR/USD currency pair continued to decline almost the entire day. This time, the U.S. dollar received strong support from the U.S. GDP report and the FOMC meeting. Thus, for the third consecutive day, we observed a consistent rise in the American currency. The GDP report informed traders that the U.S. economy grew by 3% in the second quarter — much higher than official forecasts. Later in the evening, Jerome Powell hinted that the Federal Reserve may cut the key rate only once by year-end. That was more than enough for the dollar to gain strength throughout the day and evening. As a result, the downward correction continues on higher timeframes, and the macroeconomic and fundamental background currently supports the dollar.
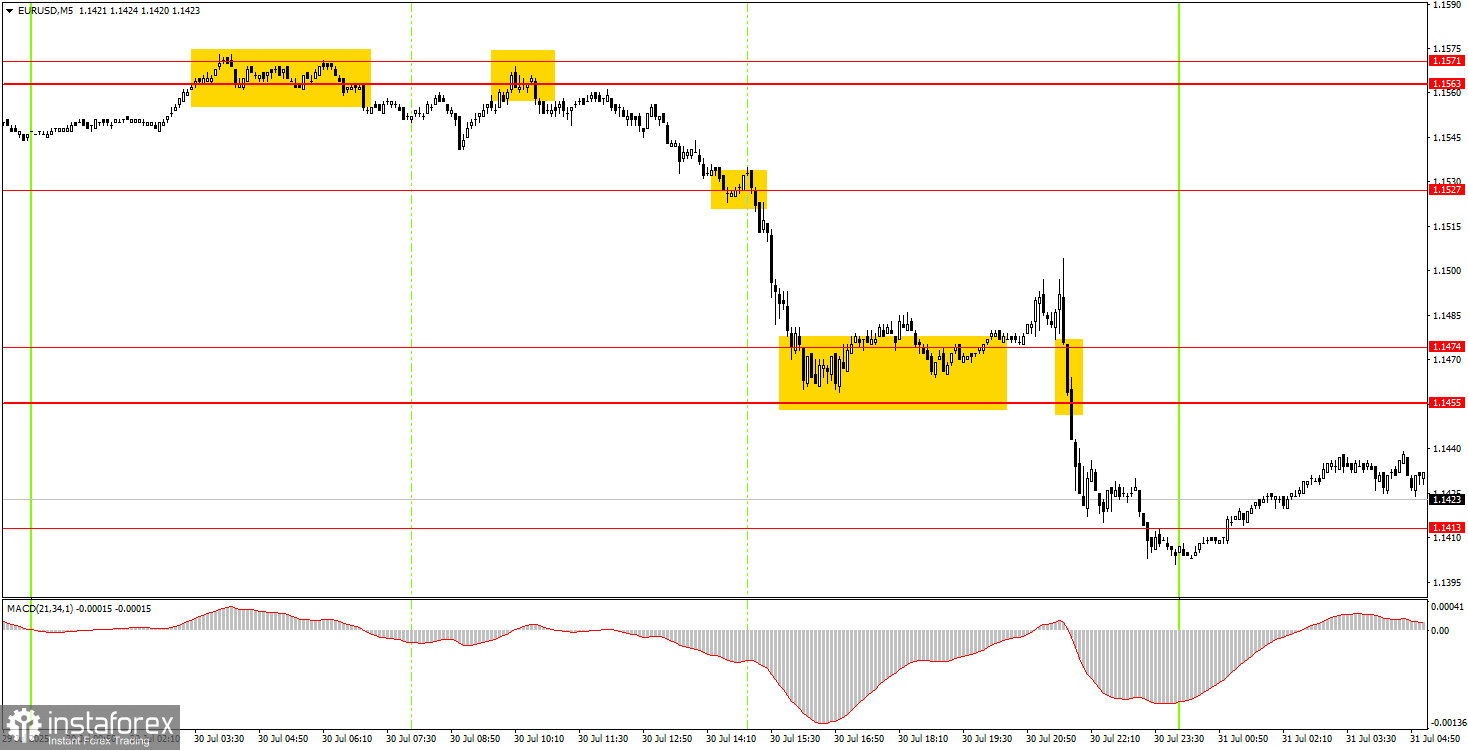
In the 5-minute timeframe on Wednesday, plenty of trading signals were generated. During the European session, novice traders could open short positions after a bounce from the 1.1563–1.1571 area. This drop ended near the 1.1455–1.1470 zone. After the FOMC results were released, another sell signal formed, but traders may have already missed it by then.
In the hourly timeframe, the EUR/USD pair has resumed its downward corrective movement, driven by the EU-U.S. trade agreement news, the strong U.S. GDP report, and Jerome Powell's rhetoric. Since Donald Trump's policies have remained unchanged lately — with continued tension around Powell and the ongoing trade war — we still do not see a reason for sustained dollar growth in the medium term. In the short term, however, the dollar may continue to strengthen, but in the long run, it is unlikely.
On Thursday, the EUR/USD pair may continue its local downward movement, and we advise novice traders to watch the 1.1413 level closely. A bounce from this level would allow traders to open long positions targeting 1.1455 and 1.1474. If the price consolidates below this level, traders may sell again, targeting 1.1363.
On the 5-minute timeframe, relevant levels for Thursday are: 1.1198–1.1218, 1.1267–1.1292, 1.1354–1.1363, 1.1413, 1.1455–1.1474, 1.1527, 1.1563–1.1571, 1.1655–1.1666, 1.1740–1.1745, 1.1808, 1.1851, 1.1908.
On Thursday, Germany and the European Union are scheduled to publish unemployment rates, while Germany has another inflation report. Of the US data, only the PCE index is of note.
Support and Resistance Levels: These are target levels for opening or closing positions and can also serve as points for placing Take Profit orders.
Red Lines: Channels or trendlines indicating the current trend and the preferred direction for trading.
MACD Indicator (14,22,3): A histogram and signal line used as a supplementary source of trading signals.
Important Events and Reports: Found in the economic calendar, these can heavily influence price movements. Exercise caution or exit the market during their release to avoid sharp reversals.
Forex trading beginners should remember that not every trade will be profitable. Developing a clear strategy and practicing proper money management are essential for long-term trading success.
Díky analytickým přehledům společnosti InstaForex získáte plné povědomi o tržních trendech! Jako zákazníkovi společnosti InstaForex je Vám k dispozici velký počet bezplatných služeb umožňujících efektivní obchodování.


