 Zůstat
Obchodní podmínky
Nástroje


The EUR/USD currency pair continues a slow downward move, seemingly unaffected by anything. Recall that technically, the pair's decline is entirely logical. On the hourly timeframe, we have a downward trend, as indicated by the trendline, while on the daily timeframe, the pair remains inside the sideways channel 1.1400–1.1830 and has reversed near its upper boundary several weeks ago. If it failed to break out of the channel, then movement toward the opposite boundary should be expected. The fundamental and macroeconomic backdrop has little impact on the pair's movement. Last week, Donald Trump conducted a military operation in Venezuela, and similar operations in Mexico, Cuba, and Colombia may follow soon. Overall, the U.S. dollar is rising, but can we conclude that the market watches events in South and Latin America with admiration? In our view, the current dollar rise is driven by about 80% by technical factors mentioned above.
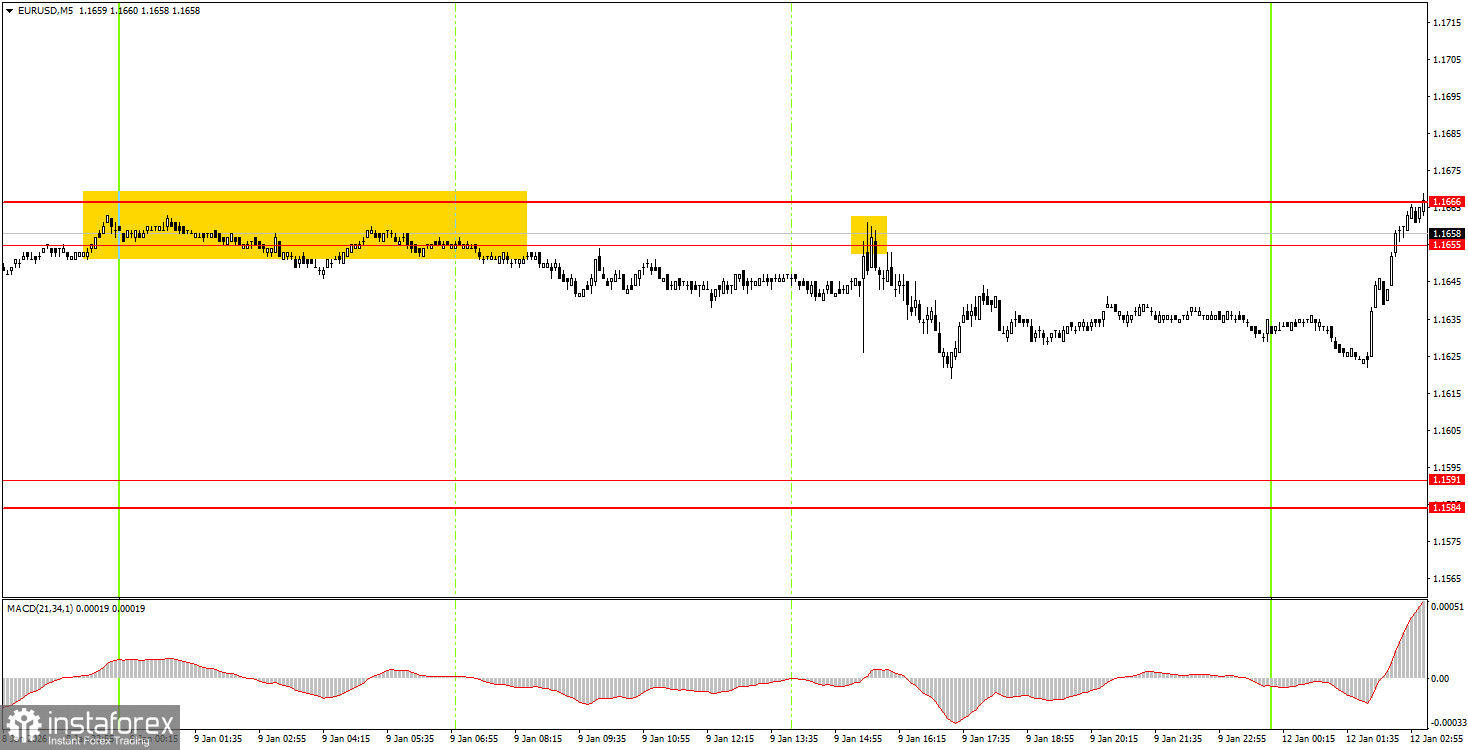
On the 5-minute timeframe, two trading signals were formed on Friday. The price bounced twice from the 1.1655–1.1666 area, and in the second case, it moved the desired 25 pips. Recall that the market showed this movement on the day Nonfarm Payrolls and the unemployment rate were published. Nevertheless, beginner traders could easily obtain small profits (commensurate with current market volatility).
On the hourly timeframe, a downward trend continues to form, as evidenced by the trendline. The 1.1800–1.1830 area, which is the upper boundary of the daily flat, was not breached, so the decline is technically logical and may continue down to 1.1400. The overall fundamental and macroeconomic backdrop remains very weak for the U.S. dollar, but the daily flat takes priority, and traders practically ignore the macroeconomic background.
On Monday, beginner traders can again trade from the 1.1655–1.1666 area. A rebound from this area would allow opening short positions with a target of 1.1584–1.1591. A close above this area would make longs relevant with a target of 1.1745.
On the 5-minute timeframe, consider the following levels: 1.1354–1.1363, 1.1413, 1.1455–1.1474, 1.1527–1.1531, 1.1550, 1.1584–1.1591, 1.1655–1.1666, 1.1745–1.1754, 1.1808, 1.1851, 1.1908, 1.1970–1.1988. Today, there are no important events or releases scheduled in the EU or the U.S. Although the market opened with a strong rise in the pair, that rise quickly ended, and intraday volatility may again be low.
Support and resistance price levels — levels that serve as targets when opening buys or sells. Take Profit can be placed near them.
Red lines — channels or trendlines that reflect the current tendency and show which direction is preferable to trade now.
MACD indicator (14,22,3) — histogram and signal line — an auxiliary indicator that can also be used as a source of signals.
Important speeches and reports (always listed in the news calendar) can strongly affect a currency pair's movement. Therefore, during their release, trading should be done with maximum caution, or positions should be closed, to avoid a sharp price reversal against the preceding move.
Beginner forex traders should remember that not every trade can be profitable. Developing a clear strategy and effective money management are the keys to long-term trading success.
Díky analytickým přehledům společnosti InstaForex získáte plné povědomi o tržních trendech! Jako zákazníkovi společnosti InstaForex je Vám k dispozici velký počet bezplatných služeb umožňujících efektivní obchodování.


