 Zůstat
Obchodní podmínky
Nástroje


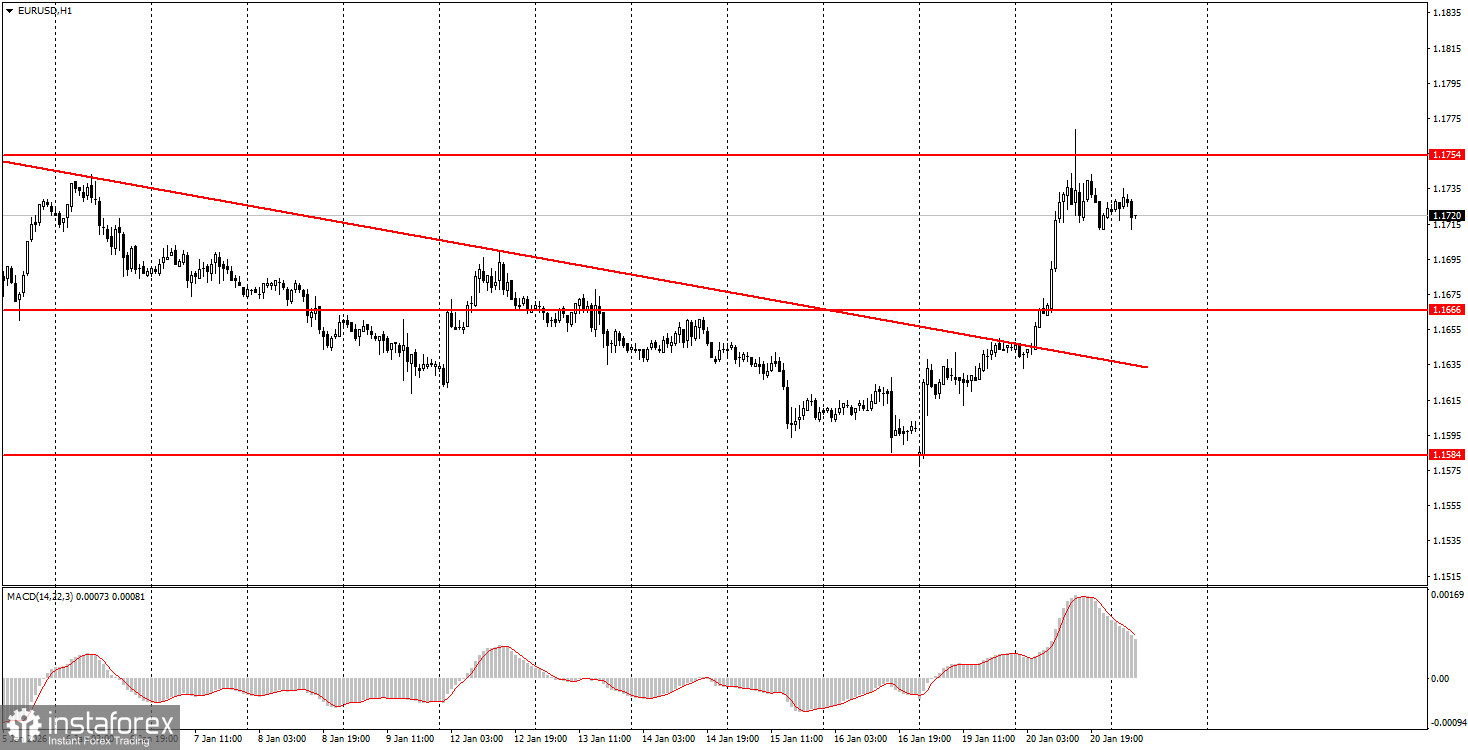
The EUR/USD currency pair continued its upward move on Tuesday, breaking the descending trendline. Thus, it became clear already in the morning that the market intends to continue disposing of the US dollar amid events around the island of Greenland. Recall that Donald Trump demanded that the authorities of Denmark and the European Union hand over or sell the island to the US, to which he received a categorical refusal. To motivate them, Trump introduced another 10% tariffs on goods from a number of European countries, effectively putting a cross over last year's trade deal. The EU is considering the possibility of introducing retaliatory sanctions and tariffs in the near future. Thus, a trade war between the US and the EU has flared up again, sending the dollar lower. Among the day's macro events, note two economic sentiment indices from the ZEW institute (for Germany and the euro area). Both showed high readings, which also helped the euro. Very soon, the price may return to the 1.1800–1.1830 area, which is the upper line of the 1.1400–1.1830 sideways channel.
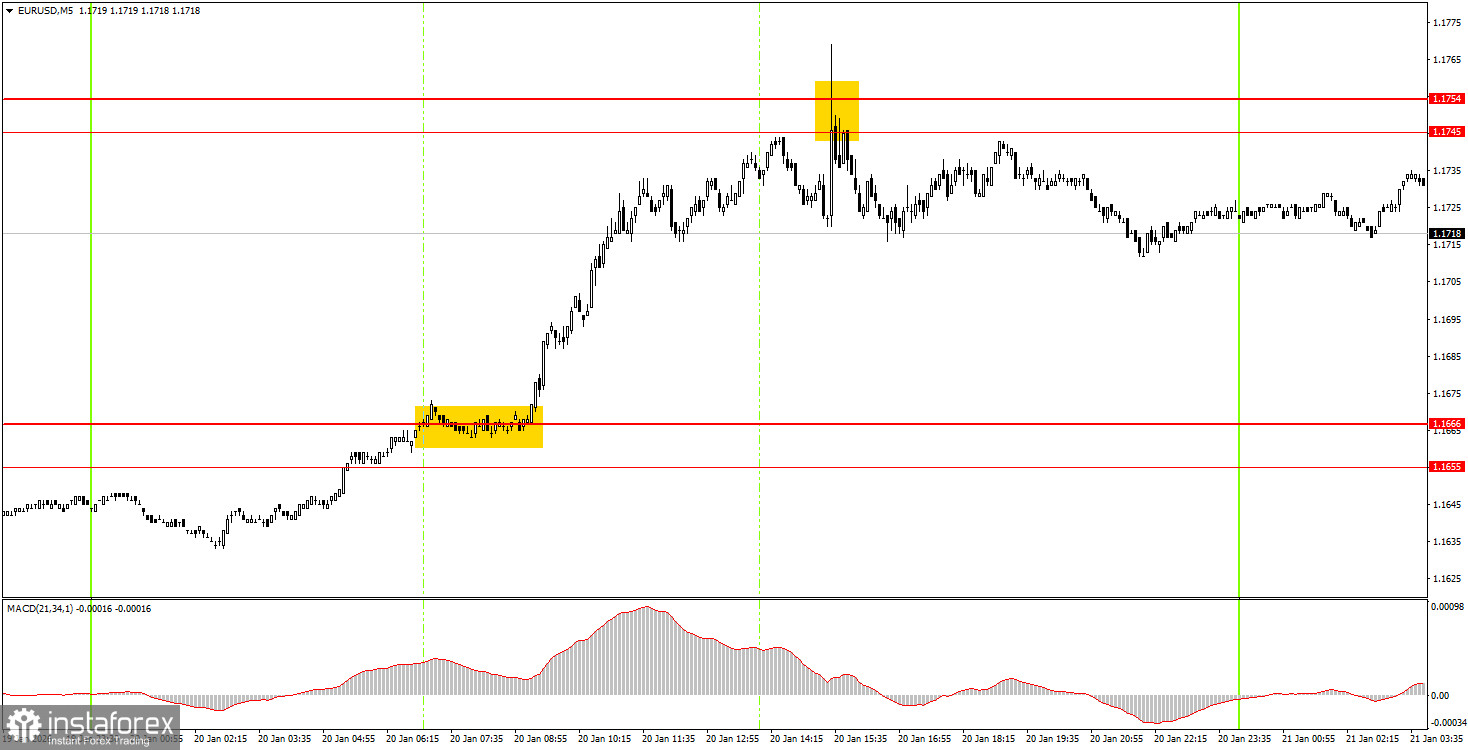
On the 5-minute TF on Tuesday, two trading signals were formed. In the morning, the pair consolidated above the 1.1655–1.1666 area, which allowed novice traders to open long positions. Literally a few hours later, the target area 1.1745–1.1754 was reached. The rebound from that area could be interpreted as a sell signal, allowing short positions to be opened. They could be closed before the end of the day with a small profit.
On the hourly timeframe, the trend changed to upward. Thus, in the near term, the pair may return to the upper boundary of the 1.1400–1.1830 sideways channel to attempt to break it once more and finally end the seven-month flat. The overall fundamental and macroeconomic backdrop remains very weak for the US dollar, but the daily-TF flat plays take priority, and traders virtually ignore the macro background.
On Wednesday, novice traders can open new long positions if the 1.1745–1.1754 area is broken, targeting 1.1800–1.1830. A bounce of price from the 1.1745–1.1754 area, as it did yesterday, allowed opening shorts targeting 1.1655–1.1666, which can be maintained today.
On the 5-minute TF, consider the levels 1.1354–1.1363, 1.1413, 1.1455–1.1474, 1.1527–1.1531, 1.1550, 1.1584–1.1591, 1.1655–1.1666, 1.1745–1.1754, 1.1808, 1.1851, 1.1908, 1.1970–1.1988. Today, ECB President Christine Lagarde will speak in the euro area; the US events calendar is empty. Events related to Greenland remain on the agenda.
Support and resistance price levels — levels that serve as targets when opening buys or sells. Take Profit can be placed near them.
Red lines — channels or trendlines that reflect the current tendency and show which direction is preferable to trade now.
MACD indicator (14,22,3) — histogram and signal line — an auxiliary indicator that can also be used as a source of signals.
Important speeches and reports (always listed in the news calendar) can strongly affect a currency pair's movement. Therefore, during their release, trading should be done with maximum caution, or positions should be closed, to avoid a sharp price reversal against the preceding move.
Beginner forex traders should remember that not every trade can be profitable. Developing a clear strategy and effective money management are the keys to long-term trading success.
Díky analytickým přehledům společnosti InstaForex získáte plné povědomi o tržních trendech! Jako zákazníkovi společnosti InstaForex je Vám k dispozici velký počet bezplatných služeb umožňujících efektivní obchodování.


