 Zůstat
Obchodní podmínky
Nástroje


Bitcoin continues to decline after a sell signal formed on the daily TF, which we had been waiting for about a month. In just two days, Bitcoin has lost $6,000. Recall that during the last leg of the downtrend, only one bearish FVG was formed, from which the price ultimately reacted. The bullish FVG was invalidated, which is not surprising. No price reaction followed it. Several new bearish FVGs may form this week as the price is moving down very quickly. Also note that Bitcoin has its own liquidity pool, similar to Ether. On the downtrend, we are almost certain that Bitcoin will fall well below the ascending trendline.
On the 4-hour TF price yesterday, a reaction was seen from the nearest bearish FVG, and then several similar patterns formed. We highlighted one — the most recent. It is from this one that a reaction may occur today. The local upward structure is broken.
The minimum medium-term decline target for Bitcoin is $70,800. During 2026, we also allow for a much larger drop in the world's leading cryptocurrency. As for the macro and fundamental backdrop, all markets are currently in a daze. Events in the new year are developing rapidly, and many of them are so contradictory that traders simply ignore them. We cannot conclude that Bitcoin rises or falls because of events related to Jerome Powell or Trump's military aggression toward Latin American countries, Iran, or Greenland.
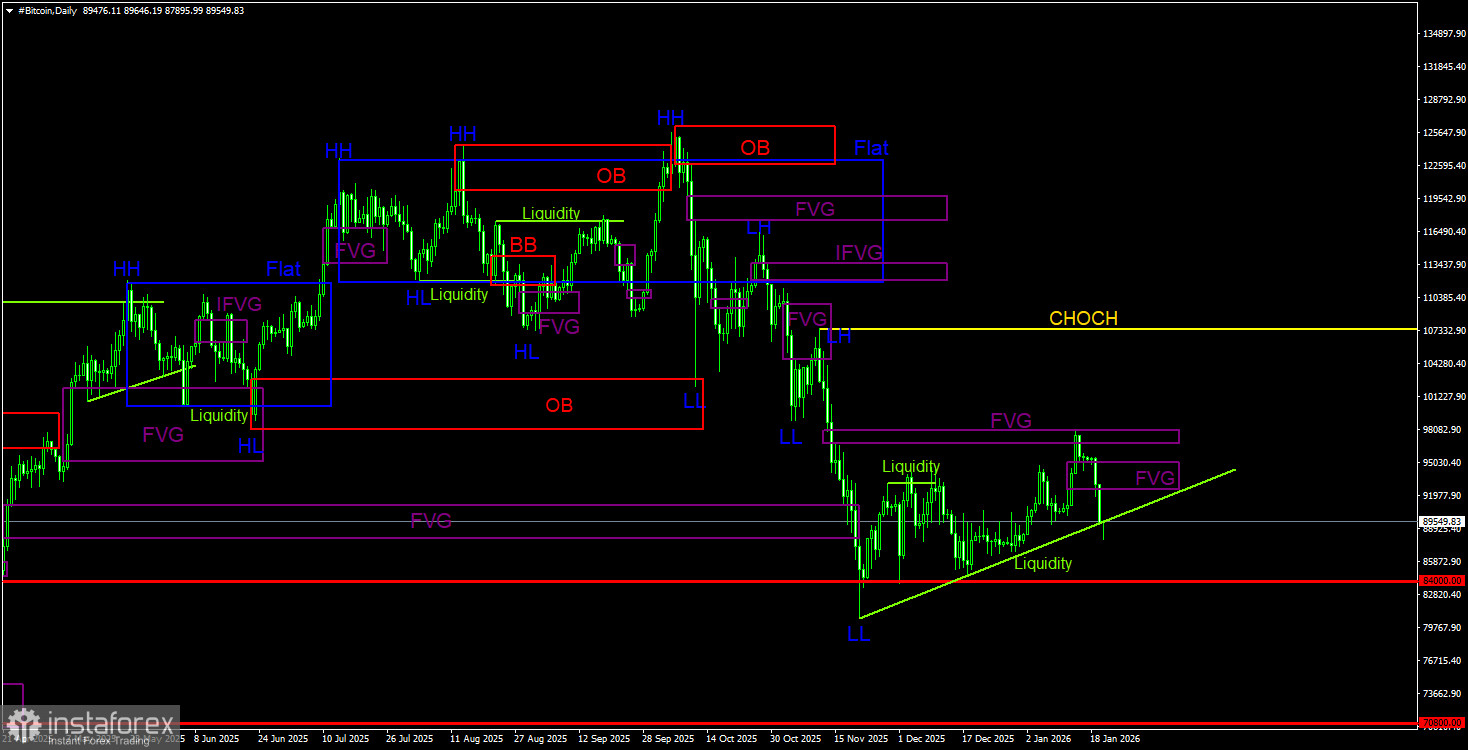
On the daily TF, Bitcoin continues to form a downtrend; the correction is ongoing. The trend structure is identified as downward, and the CHOCH line currently runs at $107,300. Only above this level can the downtrend be considered complete. In 2026, Bitcoin could fall as low as $60,000, from where its last ascent began. The only POI area for sells was the bearish FVG, to which a reaction has already been received. The trading signal has formed, and confirmation has been received. The target for the new leg down may be $70,800 — the 50.0% Fibonacci level. The bullish FVG has been invalidated, as expected.
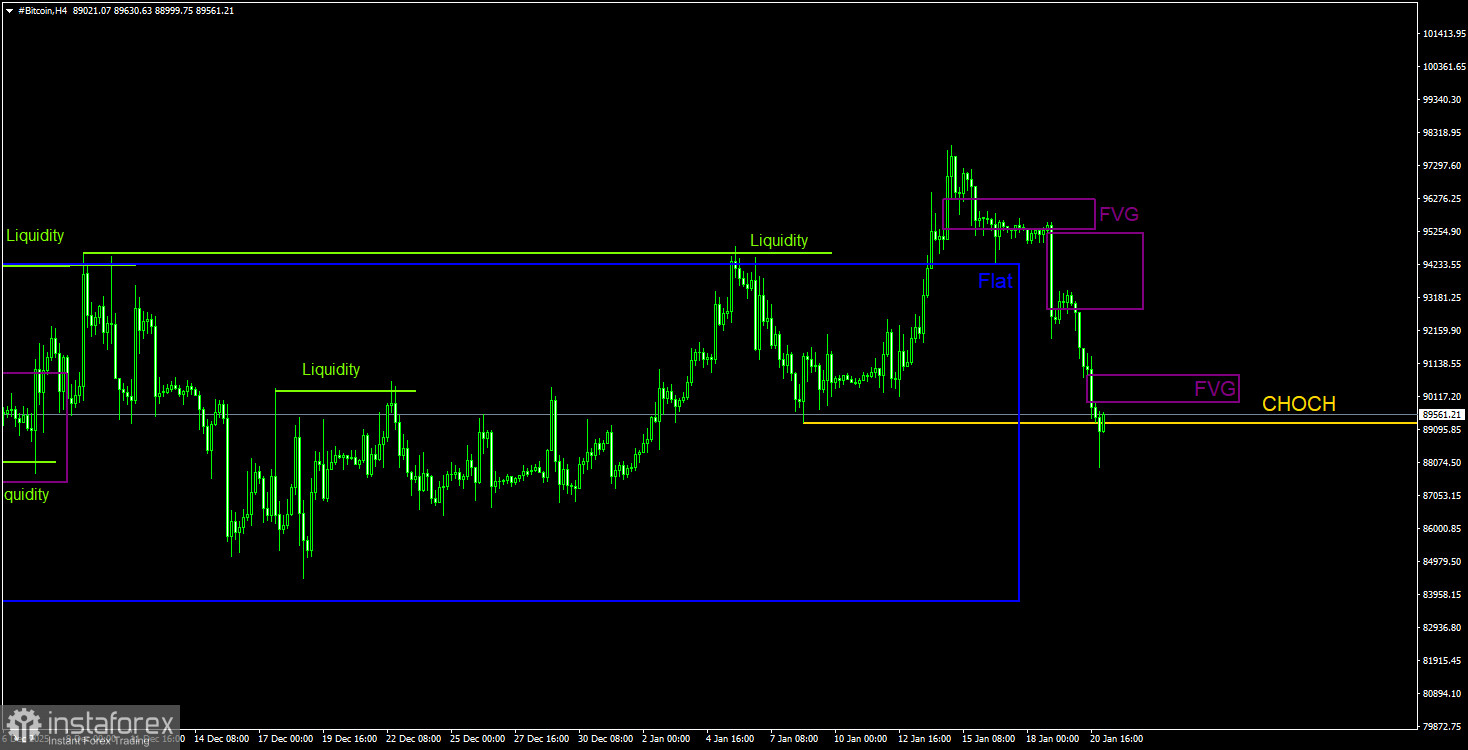
On the 4-hour TF, the price left the sideways channel in which it spent one and a half months. However, Bitcoin's rise was short-lived, since the bearish FVG on the daily TF was worked off. The upward structure on the 4-hour TF is broken; several more bearish FVGs have formed over the last few days. Given the picture on the daily TF, we assume the decline will continue, and all nearby bearish patterns can be used to open new short positions.
Bitcoin continues to form a full-fledged downtrend. The two nearest targets (the bullish OB in the $98,000–$102,700 area and the bullish FVG) have been worked off; now expect a fall to $70,800 (the 50.0% Fibonacci level of the three-year uptrend). Of the POI areas for selling on the daily TF, one can highlight the bearish FVG located in the $96,800–$98,000 area. This pattern was worked off and received a price reaction. Now the sell trade can be managed. On the 4-hour TF, bearish FVGs are forming from which additional short positions can be opened if the price reacts.
CHOCH – change of character / break of trend structure.
Liquidity – liquidity; traders' Stop Loss orders that market makers use to accumulate their positions.
FVG – Fair Value Gap / area of price inefficiency. Price moves very quickly through such areas, indicating a complete absence of one side of the market. Subsequently, the price tends to return and receive a reaction from such areas.
IFVG – Inverted Fair Value Gap. After returning to such an area, the price does not receive a reaction but impulsively breaks through it and then tests it from the other side.
OB – Order Block. The candle on which a market maker opened a position to take liquidity and form their own position in the opposite direction.
Díky analytickým přehledům společnosti InstaForex získáte plné povědomi o tržních trendech! Jako zákazníkovi společnosti InstaForex je Vám k dispozici velký počet bezplatných služeb umožňujících efektivní obchodování.


