 Zůstat
Obchodní podmínky
Nástroje


The GBP/USD currency pair also rose slightly on Wednesday, enough to break the descending trend line. Thus, both major currency pairs have now broken their trend lines. However, as with the euro, the pound needs to break above the Senkou Span B line. In our view, the fundamentals and macroeconomics remain on the side of all dollar competitors, so it is only a matter of waiting for a new upward trend on the hourly timeframe. In the long term, the upward trend remains intact.
On Wednesday, there were no significant reports or events in either the UK or the U.S., and the UK events calendar is completely empty this week. The market has already priced in the worst news from the UK, while the never-ending stream of negativity from the U.S. appears to be given less urgency by traders. In our opinion, the news from January and February is enough to send the dollar back into the abyss. However, it should be understood that this is, after all, the dollar, which has appreciated for 17 consecutive years and has served as the world's primary means of settlement and a key reserve for central banks for decades.
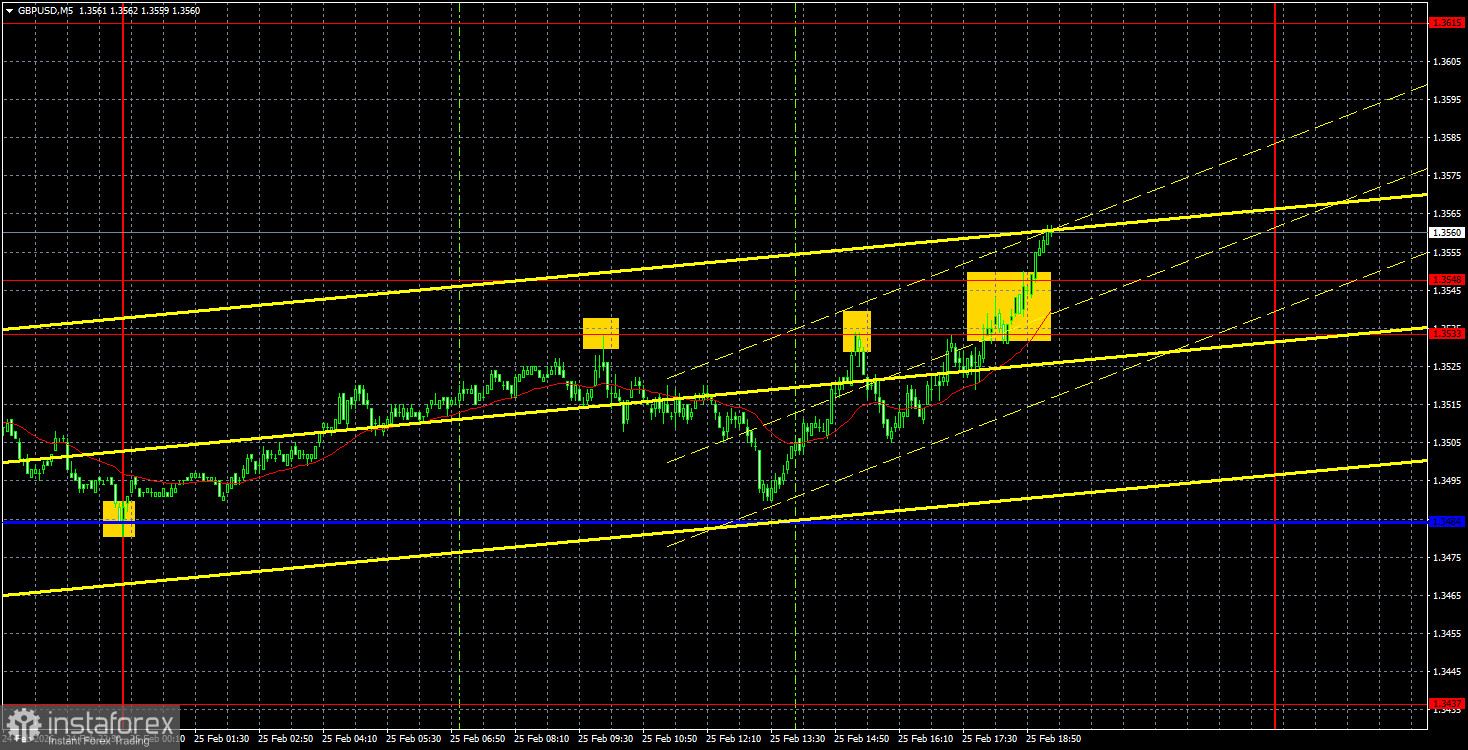
On the 5-minute timeframe, four trading signals were formed on Wednesday. The first buy signal was generated overnight—a bounce from the critical line. Traders likely struggled to capitalize on it. Following that, there were two bounces from the 1.3533 level, with the first resulting in a drop of around 30 pips. The last signal was a buy signal triggered by a breakout above the 1.3533-1.3548 area, indicating that upward movement could continue today.
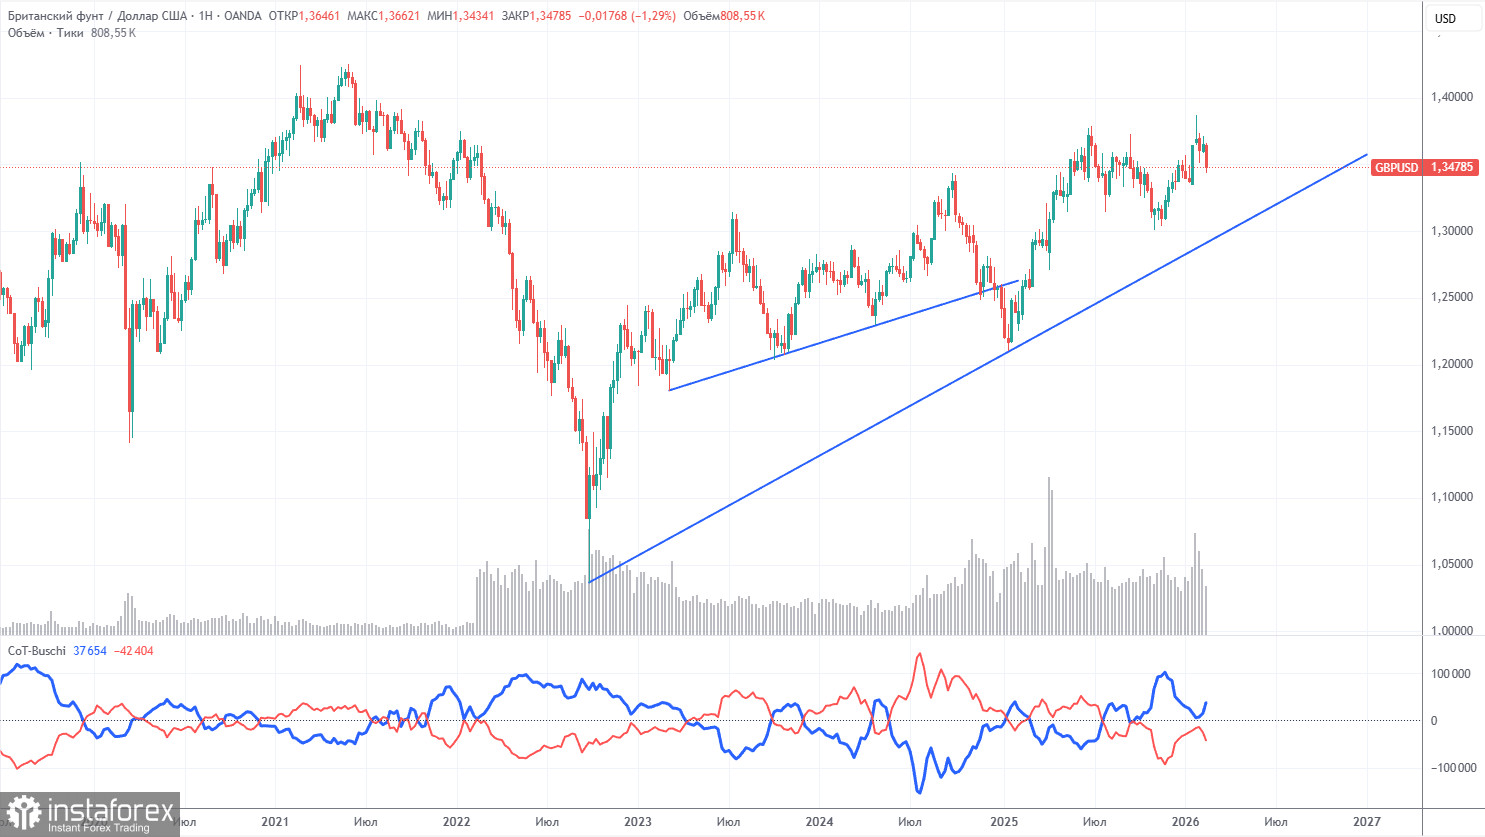
COT reports for the British pound show that, in recent years, sentiment among commercial traders has been constantly changing. The red and blue lines, reflecting the net positions of commercial and non-commercial traders, frequently cross each other and are mostly found near the zero mark. Currently, the lines are getting closer, with non-commercial traders still dominating with... sales. Recently, speculators have been aggressively increasing long positions, so a change in sentiment may occur soon, though it is unlikely to significantly affect the GBP/USD pair.
The dollar continues to decline due to Donald Trump's policies, as seen on the weekly timeframe (illustration above). The trade war will continue in one form or another for a long time, and the Fed will, in any case, start lowering rates in the next 12 months. Demand for the dollar will inevitably decline. According to the latest COT report (as of February 17) for the British pound, the "Non-commercial" group closed 6,400 BUY contracts and opened 10,200 SELL contracts. Thus, the net position of non-commercial traders decreased by 16,600 contracts over the week.
In 2025, the pound rose significantly, but it should be understood that the reason is singular—Donald Trump's policies. Once this reason is neutralized, the dollar may begin to rise. But when this will happen, no one knows.
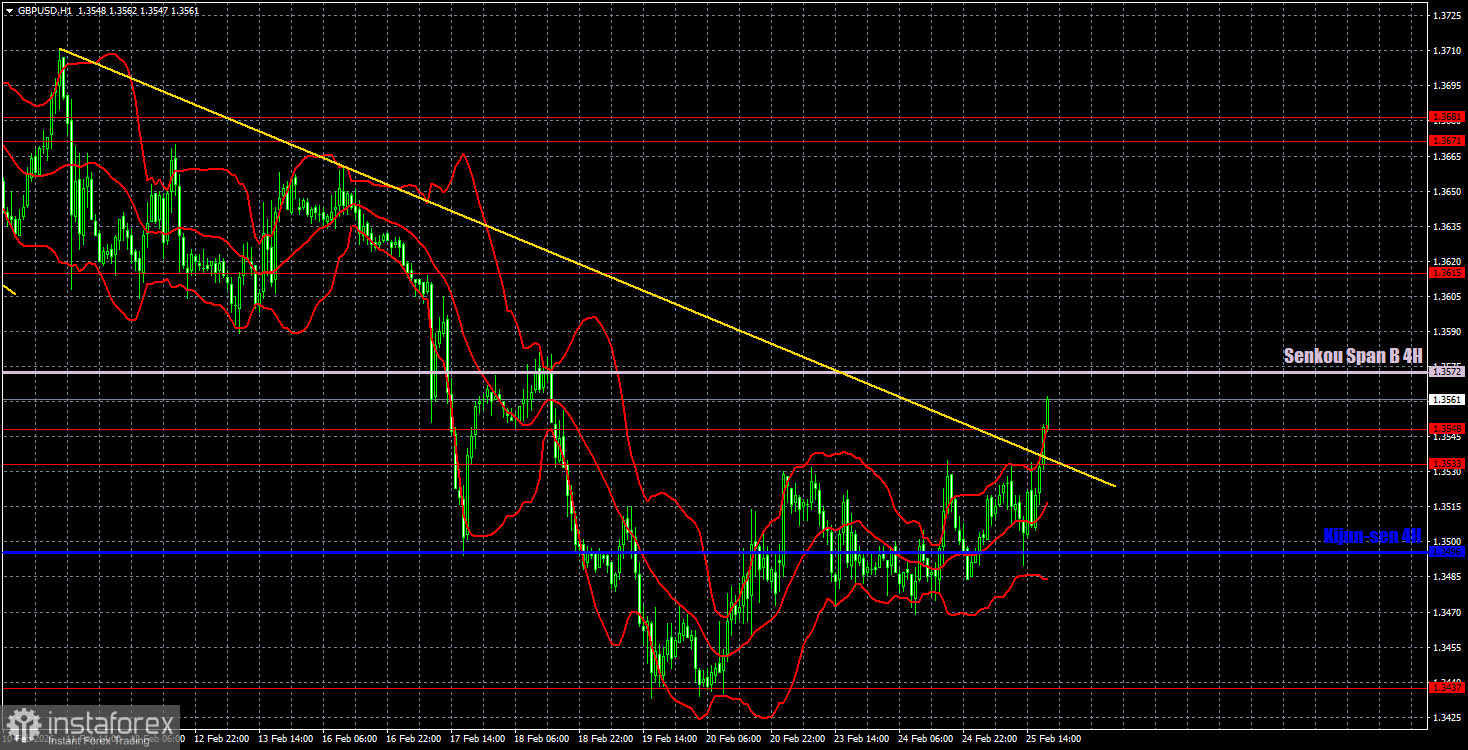
On the hourly timeframe, the GBP/USD pair may transition to forming an upward trend. Various events have constantly hindered the growth of the British currency in recent times. Many negative news items for the dollar have simply been ignored by the market. We still believe that, in the medium term, the British pound will rise amid a weakening US dollar. It is crucial at this moment to break above the Senkou Span B line.
For February 26, we highlight the following important levels: 1.3201-1.3212, 1.3307, 1.3369-1.3377, 1.3437, 1.3533-1.3548, 1.3615, 1.3671-1.3681, 1.3751-1.3763, 1.3846-1.3886, and 1.3948. The Senkou Span B line (1.3572) and Kijun-sen (1.3496) may also serve as sources of signals. It is recommended to set the Stop Loss at breakeven when the price has moved in the correct direction by 20 pips. The lines of the Ichimoku indicator may shift during the day, which should be taken into account when determining trading signals.
On Thursday, there are no significant events or reports scheduled in the UK. In the U.S., a report on jobless claims will be published, which is notably a secondary concern. Technical analysis will take precedence for traders today.
Today, traders may consider remaining in long positions targeting 1.3615, as the price has broken through the area of 1.3533-1.3548, but it is important that the Senkou Span B line allows the price to move upward. Short positions will become relevant with a target of 1.3496 if the price consolidates below the 1.3533-1.3548 area.
Díky analytickým přehledům společnosti InstaForex získáte plné povědomi o tržních trendech! Jako zákazníkovi společnosti InstaForex je Vám k dispozici velký počet bezplatných služeb umožňujících efektivní obchodování.


