 Zůstat
Obchodní podmínky
Nástroje


On Friday, the EUR/USD currency pair failed to show either growth or decline. The current situation in global markets is approaching the threshold of "panic." There are very few logical movements, if any. Everything revolves around the war in Iran and the consequences that have already devastated the markets within the first week of confrontation. Last night, oil prices rose to $120 per barrel, and yesterday it became known that Donald Trump is ready to order a ground military operation in Iran. Thus, the current state of the U.S. labor market, unemployment rates, inflation, and the decisions the Fed will make in the near future no longer matter to the market. On Friday, with absolutely disappointing Non-Farm Payrolls and unemployment reports, the dollar had every chance to lose 100 pips. Instead, we saw a new rise in the American currency on Monday night. Now we must wait for the landing of American and Israeli troops in Iran and hope that the conflict does not stretch on for years.
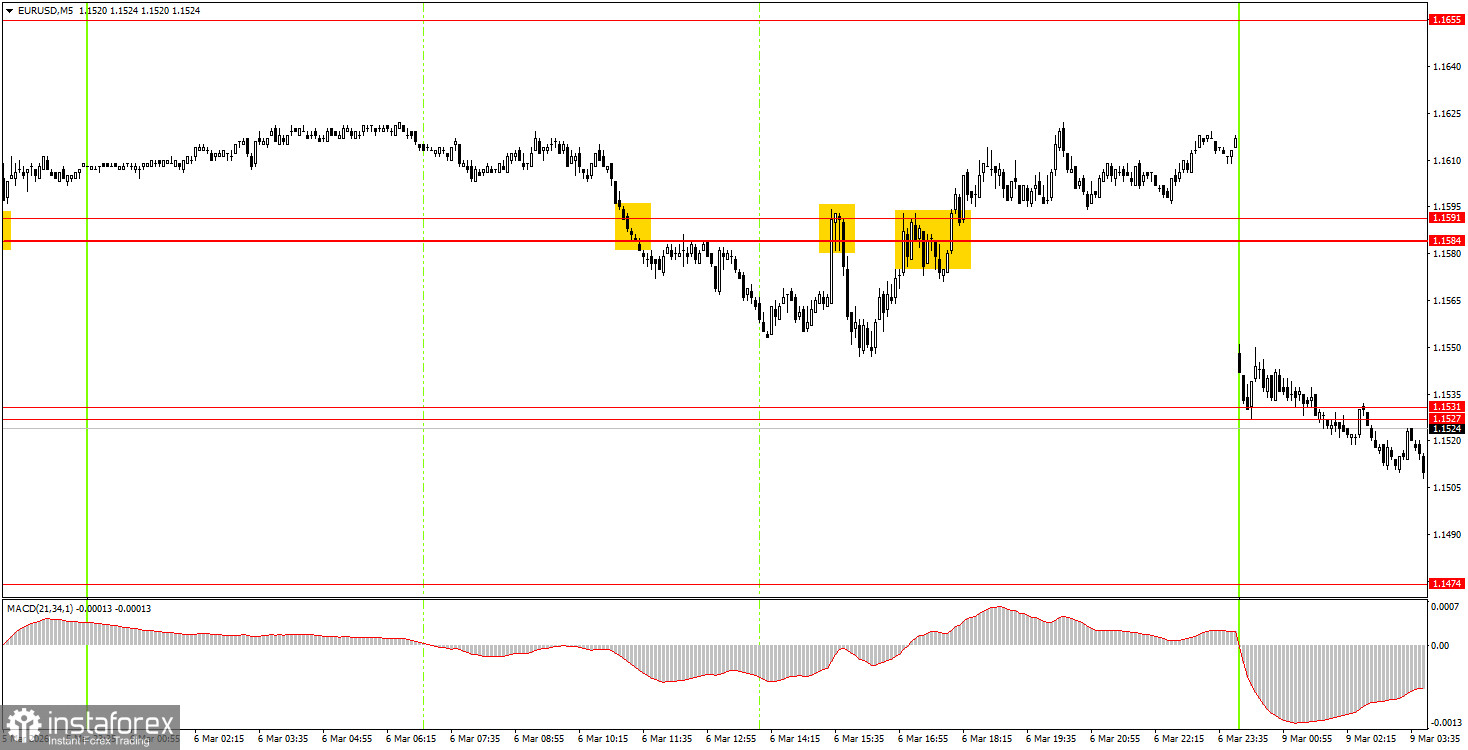
On the 5-minute timeframe, three trading signals were formed on Friday: two for selling and one for buying. In all cases, the price moved in the required direction by at least 15 pips, so none of the trades incurred a loss. However, achieving a profit proved very difficult, as none of the target levels were met.
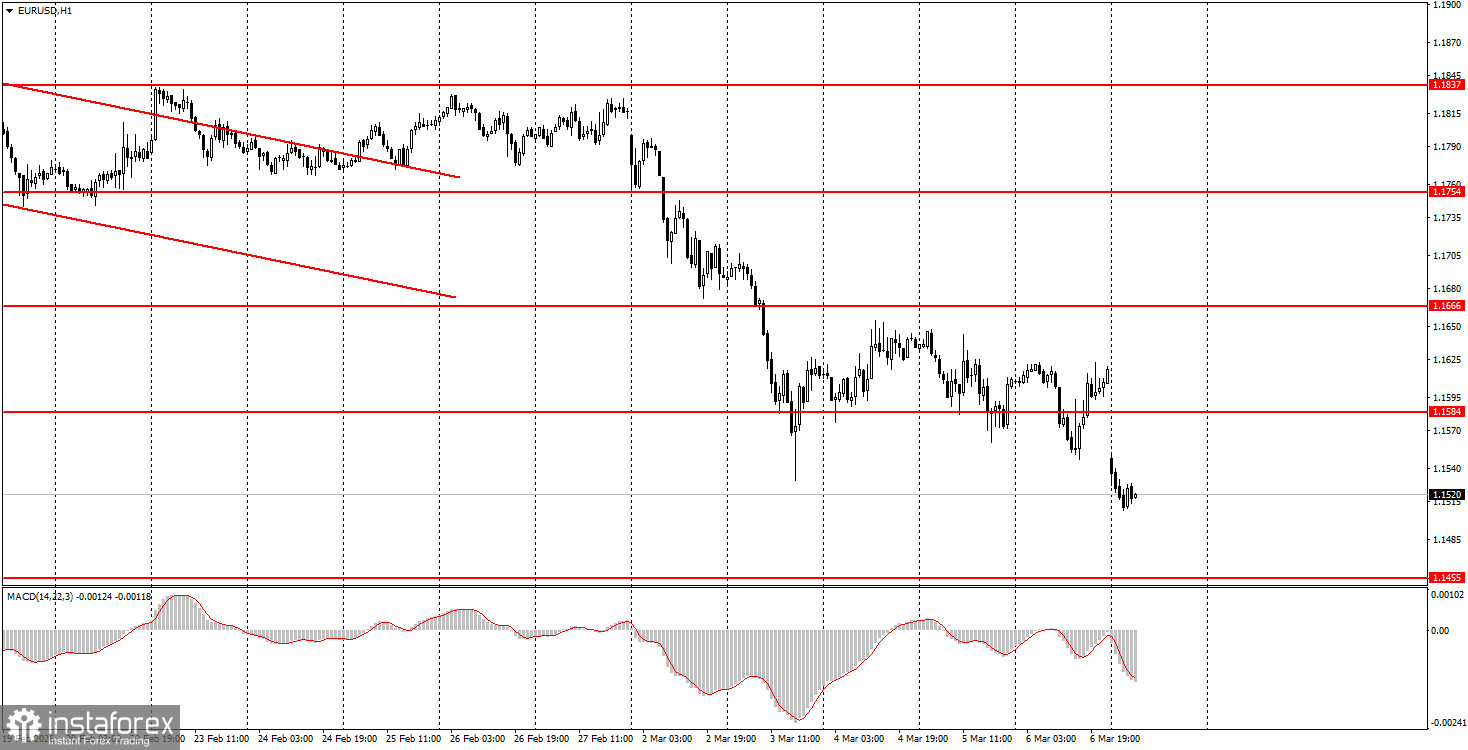
On the hourly timeframe, the downward trend has resumed, but only "thanks" to the new escalation in the Middle East. At the beginning of 2026, a long-term upward trend resumed, so we expect a new medium-term increase in the euro. The overall fundamental background remains very challenging for the U.S. dollar, as confirmed by reports on the labor market, GDP, and unemployment. However, at this time, geopolitics takes precedence over economics.
On Monday, beginner traders can consider short positions if there is a rebound from the 1.1527-1.1531 area, targeting 1.1455-1.1474. A price consolidation above the 1.1527-1.1531 area will allow opening long positions with a target of 1.1584-1.1591.
On the 5-minute timeframe, important levels to watch include 1.1354-1.1363, 1.1413, 1.1455-1.1474, 1.1527-1.1531, 1.1584-1.1591, 1.1655-1.1666, 1.1745-1.1754, 1.1830-1.1837, and 1.1899-1.1908. On Monday, a report on industrial production in Germany will be published in the Eurozone, while the U.S. calendar of events is empty. However, price movements during the day may be strong and unpredictable as the situation in the Middle East intensifies.
Price levels of support and resistance are levels that serve as targets when opening buys or sells. Take Profit levels can be placed around them.
Red lines represent channels or trend lines that show the current trend and indicate the direction in which it is preferable to trade now.
The MACD indicator (14,22,3) – the histogram and the signal line – is a supporting indicator that can also be used as a source of signals.
Important speeches and reports (always included in the news calendar) can significantly affect the movement of the currency pair. Therefore, during their release, trading should be done with utmost caution, or traders should exit the market to avoid sharp price reversals against the previous movement.
Beginning traders in the forex market should remember that not every trade can be profitable. Developing a clear strategy and effective money management are the keys to long-term trading success.
Díky analytickým přehledům společnosti InstaForex získáte plné povědomi o tržních trendech! Jako zákazníkovi společnosti InstaForex je Vám k dispozici velký počet bezplatných služeb umožňujících efektivní obchodování.


