 Zůstat
Obchodní podmínky
Nástroje


The GBP/USD pair continued its weak downward movement on Thursday, pressured by the geopolitical situation in the Middle East. It is important to remember that the situation in the Middle East remains tense despite Donald Trump's repeated peace statements. The US President has delayed his decision to strike Iranian energy assets for the second time, yet there is still no official information regarding negotiations between Washington and Tehran—only rumors. As such, neither the oil market nor the currency market sees sufficient grounds to trade under a de-escalation scenario. Oil continues to creep upwards, with experts predicting a rise to at least $150 per barrel, and traders see no reason to part with the US dollar. Neither the UK nor the US had any significant reports yesterday, leading to low volatility for the second consecutive day. Today may repeat this pattern for a third time.
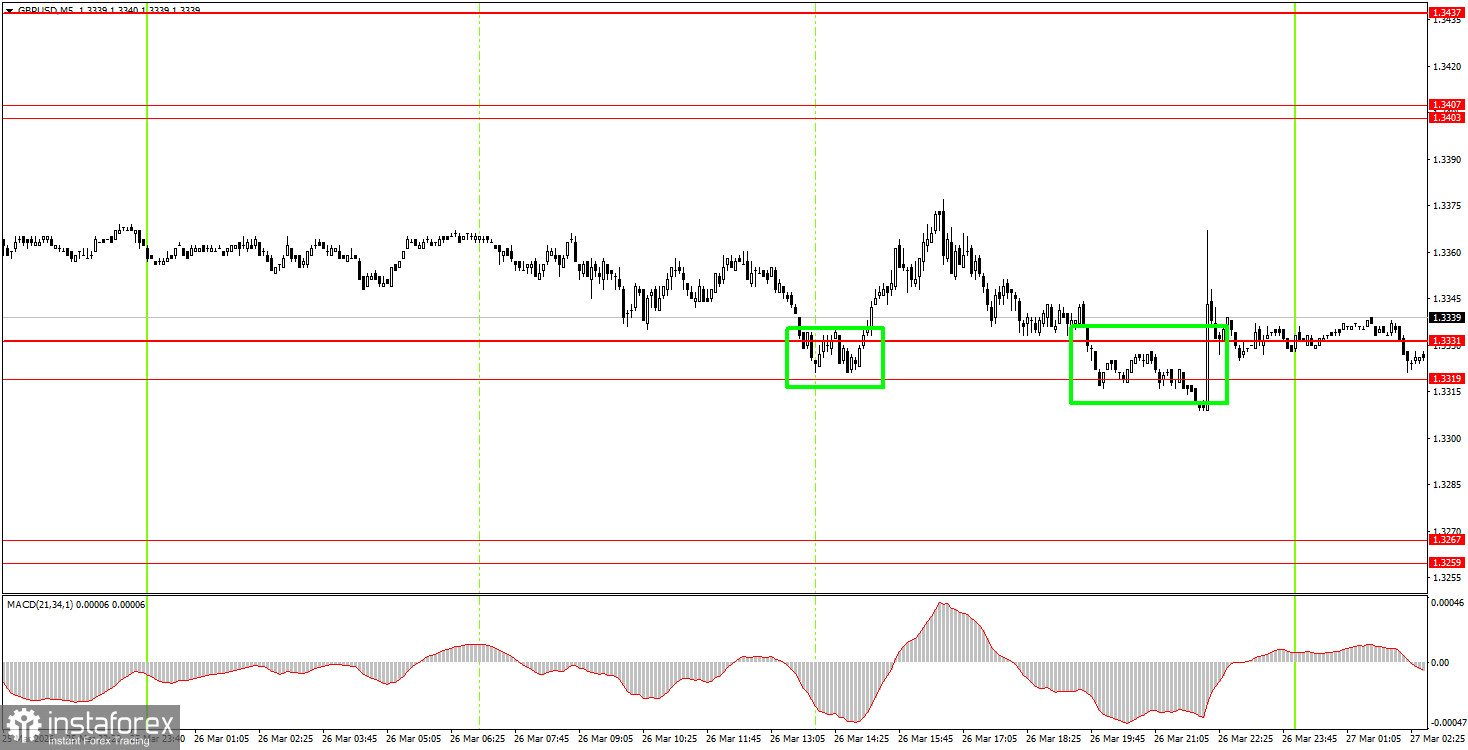
On the 5-minute timeframe, two buy signals were formed on Thursday. The price bounced twice off the area of 1.3319-1.3331. At the beginning of the US trading session, beginner traders could have acted on the signal, but profits could only be realized by manually closing the trade after a couple of hours. By the end of the day, the pair's quotes returned to the 1.3319-1.3331 range. The second bounce formed during the night.
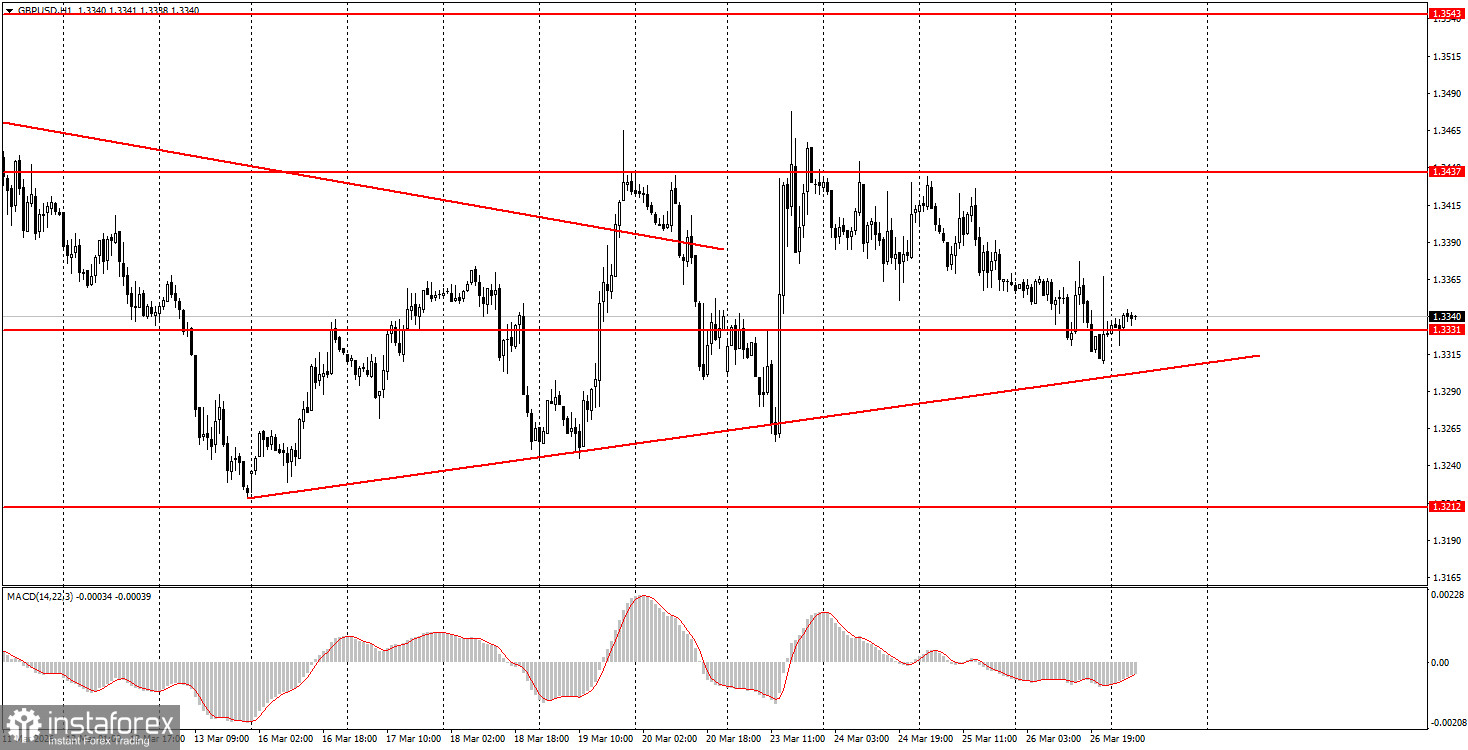
On the hourly timeframe, the GBP/USD pair continues to form a weak and uncertain upward trend. There are no global grounds for medium-term dollar growth, so in 2026, we expect a resumption of the global upward trend from 2025, which may bring the pair to at least 1.4000. However, this requires a reduction in global geopolitical tensions.
On Friday, beginner traders may consider opening short positions if the price consolidates below the 1.3319-1.3331 area and the trend line, targeting 1.3259-1.3267. A bounce from the area of 1.3319-1.3331 will allow for the opening of long positions with a target of 1.3403-1.3407.
On the 5-minute timeframe, trading levels to consider are 1.3096-1.3107, 1.3203-1.3212, 1.3259-1.3267, 1.3319-1.3331, 1.3403-1.3407, 1.3437-1.3446, 1.3484-1.3489, 1.3529-1.3543, 1.3643-1.3652, and 1.3695-1.3741-1.3751. Today, there are no major events or reports scheduled in the UK or the US, but a retail sales report will be released in Britain, and a consumer sentiment index from the University of Michigan will be released in the US. In the absence of other news and events, these reports may provoke a slight market reaction.
Price levels of support and resistance are levels that serve as targets when opening buys or sells. Take Profit levels can be placed around them.
Red lines represent channels or trend lines that show the current trend and indicate the direction in which it is preferable to trade now.
The MACD indicator (14,22,3) – the histogram and the signal line – is a supporting indicator that can also be used as a source of signals.
Important speeches and reports (always included in the news calendar) can significantly affect the movement of the currency pair. Therefore, during their release, trading should be done with utmost caution, or traders should exit the market to avoid sharp price reversals against the previous movement.
Beginning traders in the forex market should remember that not every trade can be profitable. Developing a clear strategy and effective money management are the keys to long-term trading success.
Díky analytickým přehledům společnosti InstaForex získáte plné povědomi o tržních trendech! Jako zákazníkovi společnosti InstaForex je Vám k dispozici velký počet bezplatných služeb umožňujících efektivní obchodování.


