 Zůstat
Obchodní podmínky
Nástroje


The EUR/USD currency pair showed absolutely no interesting movements on Friday. Moreover, volatility dropped to minimal levels despite a strong and vibrant macroeconomic backdrop. Of course, when the Non-Farm Payroll and unemployment reports were released in the US, the market pretended to be greatly interested in the data and reacted with a 30-pip move. This was despite the fact that the Non-Farm figures exceeded forecasts by three times and that the unemployment rate, contrary to expectations, decreased. Thus, we received further confirmation that the macroeconomic background is not significant at this time. The market is waiting for a resolution in the Middle Eastern conflict, anticipating new strikes from the US and Israel against Iran, followed by retaliatory strikes that could likely raise oil prices and demand for the dollar again. Geopolitics remains not just a key factor but essentially the only one.
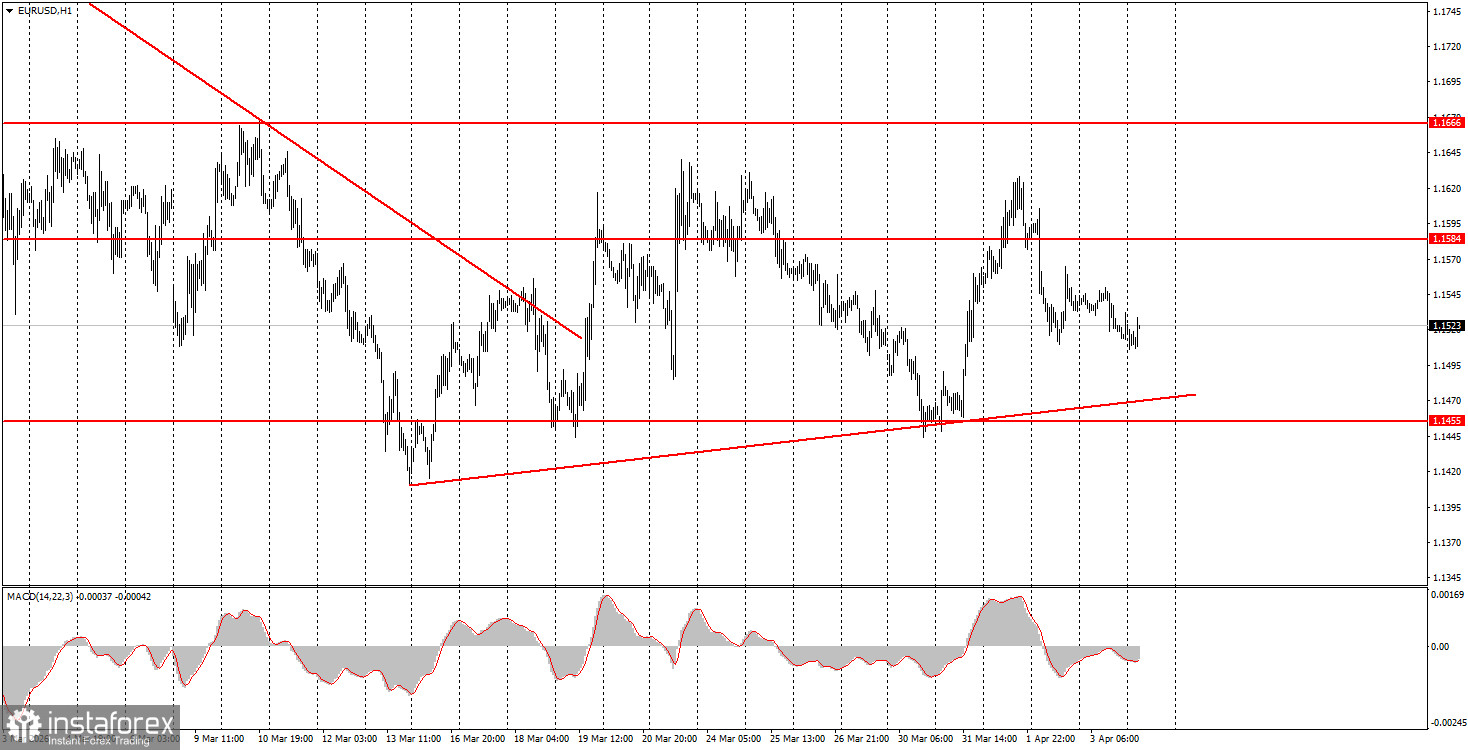
On the hourly timeframe, the upward trend is once again formally relevant due to the adjustment of the trend line. However, the market continues to trade solely on geopolitics and emotions. Therefore, the "roller coaster" may continue for a long time, with macroeconomic, technical, and fundamental factors holding little significance. Trump continually provokes both crashes and surges in the US dollar.
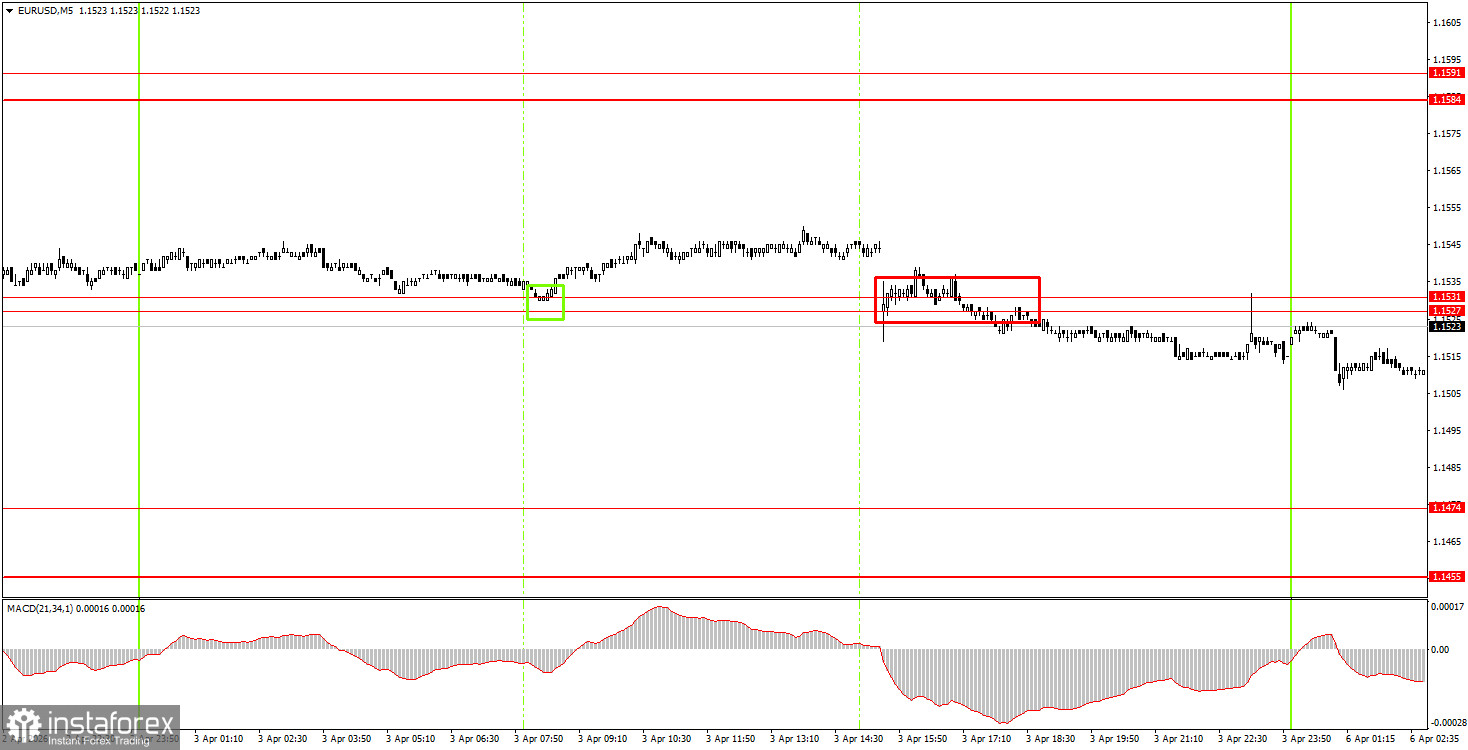
On Monday, beginner traders may consider short positions if the price bounces from the 1.1527-1.1531 area, targeting 1.1455-1.1474. A consolidation above the 1.1527-1.1531 area will allow for long positions with a target of 1.1584-1.1591.
On the 5-minute timeframe, levels to consider include: 1.1267-1.1292, 1.1354-1.1363, 1.1413, 1.1455-1.1474, 1.1527-1.1531, 1.1584-1.1591, 1.1655-1.1666, 1.1745-1.1754, 1.1830-1.1837, and 1.1899-1.1908. On Monday, the US ISM Services Index will be published, but we saw how the market reacted to key reports on Friday. It is likely that there will be no strong reaction to the ISM index, and the market will continue to wait for geopolitical events.
Price levels of support and resistance are levels that serve as targets when opening buys or sells. Take Profit levels can be placed around them.
Red lines represent channels or trend lines that show the current trend and indicate the direction in which it is preferable to trade now.
The MACD indicator (14,22,3) – the histogram and the signal line – is a supporting indicator that can also be used as a source of signals.
Important speeches and reports (always included in the news calendar) can significantly affect the movement of the currency pair. Therefore, during their release, trading should be done with utmost caution, or traders should exit the market to avoid sharp price reversals against the previous movement.
Beginning traders in the forex market should remember that not every trade can be profitable. Developing a clear strategy and effective money management are the keys to long-term trading success.
Díky analytickým přehledům společnosti InstaForex získáte plné povědomi o tržních trendech! Jako zákazníkovi společnosti InstaForex je Vám k dispozici velký počet bezplatných služeb umožňujících efektivní obchodování.


