 Zůstat
Obchodní podmínky
Nástroje


The GBP/USD currency pair also continued its upward movement on Tuesday. There were no significant macroeconomic or fundamental events throughout the day, and no positive geopolitical news was reported. Andrew Bailey's speech took place late in the evening and could not influence the trading session during the day. Thus, for the second consecutive day, we observed aggressive sell-offs of the U.S. dollar. We believe that there is only one reason for this—geopolitical factors are no longer perceived by the market as the sole possible trading factor. Recall that over the last two months, we have repeatedly said that without geopolitical factors, the dollar would never have risen by 600-700 points. Traders ignored vast amounts of negative information from across the ocean. Now, it seems, the time has come to repay debts.
On the hourly timeframe, the upward trend continues and raises no doubts. However, there is still no trend line, so traders can only rely on technical levels and Ichimoku indicator lines. Nevertheless, this is sufficient for profitable trading at this time. In the next nine months, we expect a resumption of the long-term upward trend and the breaking of this year's highs.
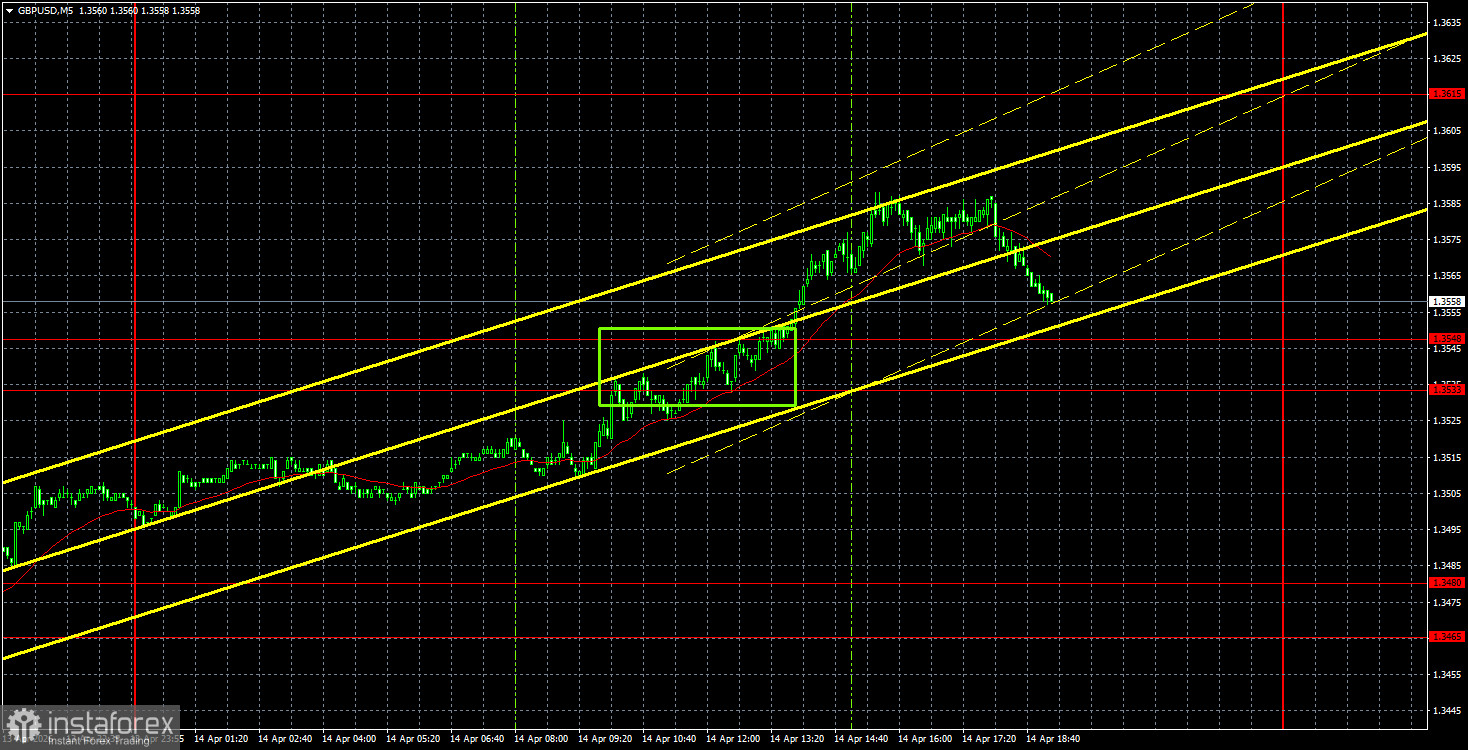
On the 5-minute timeframe, only one trading signal was formed on Tuesday. During the European trading session, the pair broke through the 1.3533-1.3548 range, allowing traders to open long positions. If the price remains above the 1.3533-1.3548 area, the trade can be maintained today with a target of 1.3615.
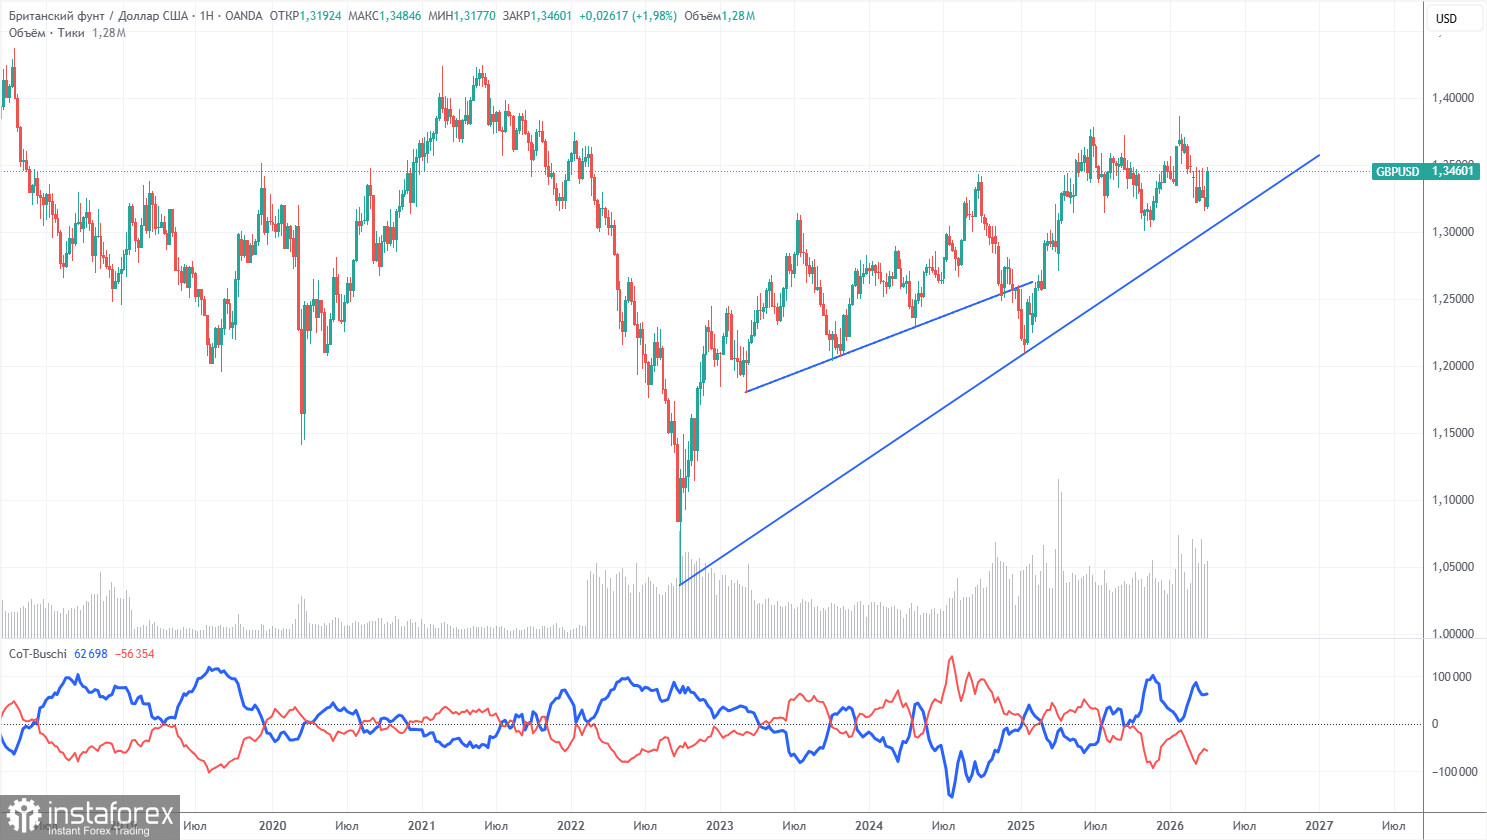
The COT reports for the British pound show that, in recent years, commercial traders' sentiment has been constantly changing. The red and blue lines representing the net positions of commercial and non-commercial traders frequently cross each other and are usually close to the zero mark. Currently, the lines are diverging, with non-commercial traders still dominating with... selling positions. However, given the events in the Middle East, it is not surprising that demand for riskier currencies is falling while demand for the dollar is rising.
In the long term, the dollar continues to decline due to Donald Trump's policies, as shown on the weekly timeframe (illustration above). The trade war will continue in one form or another for a long time, but geopolitical factors currently take precedence, providing strong support to the US dollar. According to the latest COT report (from April 7), the "Non-commercial" group closed 3,900 buy contracts and 300 sell contracts. Thus, the net position of non-commercial traders decreased by 3,600 contracts over the week.
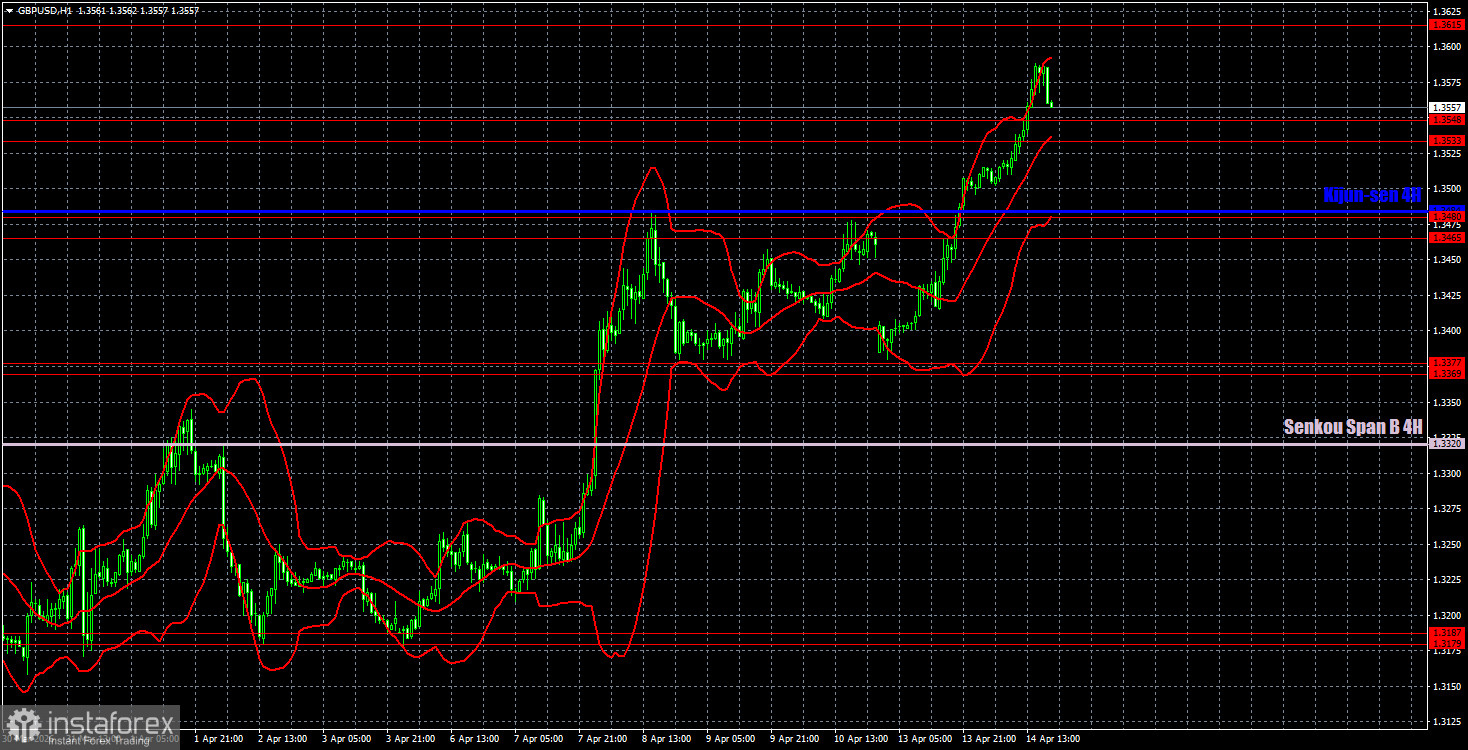
On the hourly timeframe, the GBP/USD pair continues to form an upward trend, which could be nullified if a full-scale war resumes in the Middle East. It is also worth noting that the influence of geopolitics is weakening, judging by the movements on Monday and Tuesday; however, military actions in the region remain on hold. The Strait of Hormuz was blocked even before Trump's blockade.
On April 15, we highlight the following important levels: 1.3096-1.3115, 1.3179-1.3187, 1.3369-1.3377, 1.3465-1.3480, 1.3533-1.3548, 1.3615, 1.3671-1.3681, 1.3751-1.3763. The Senkou Span B line (1.3320) and Kijun-sen line (1.3484) may also serve as sources of signals. It is recommended to place the stop-loss order at breakeven after the price has moved in the right direction by 20 pips. The Ichimoku indicator lines may shift throughout the day, which should be taken into account when determining trading signals.
On Wednesday, a speech by Bank of England Governor Andrew Bailey is scheduled in the UK, and this may be interesting. Recall that the British central bank may raise the key interest rate this month amid accelerating inflation. Therefore, Bailey may provide hints to the market on whether to expect a policy tightening this month. In the U.S., the macroeconomic event calendar is almost empty on Wednesday.
Today, traders may consider short positions with a target of 1.3465-1.3480 if the price consolidates below the 1.3533-1.3548 range or rebounds from 1.3615. Long positions can be maintained with targets at 1.3615 and 1.3671-1.3681 if the price remains above the 1.3533-1.3548 area.
Support and resistance price levels are thick red lines around which the movement may end. They are not sources of trading signals.
The Kijun-sen and Senkou Span B lines are lines of the Ichimoku indicator, transferred to the hourly timeframe from the 4-hour timeframe. They are strong lines.
Extreme levels are thin red lines from which the price previously rebounded. They are sources of trading signals.
Yellow lines are trend lines, trend channels, and any other technical patterns.
Indicator 1 on the COT charts shows the size of the net position of each category of traders.
Díky analytickým přehledům společnosti InstaForex získáte plné povědomi o tržních trendech! Jako zákazníkovi společnosti InstaForex je Vám k dispozici velký počet bezplatných služeb umožňujících efektivní obchodování.


