 Zůstat
Obchodní podmínky
Nástroje


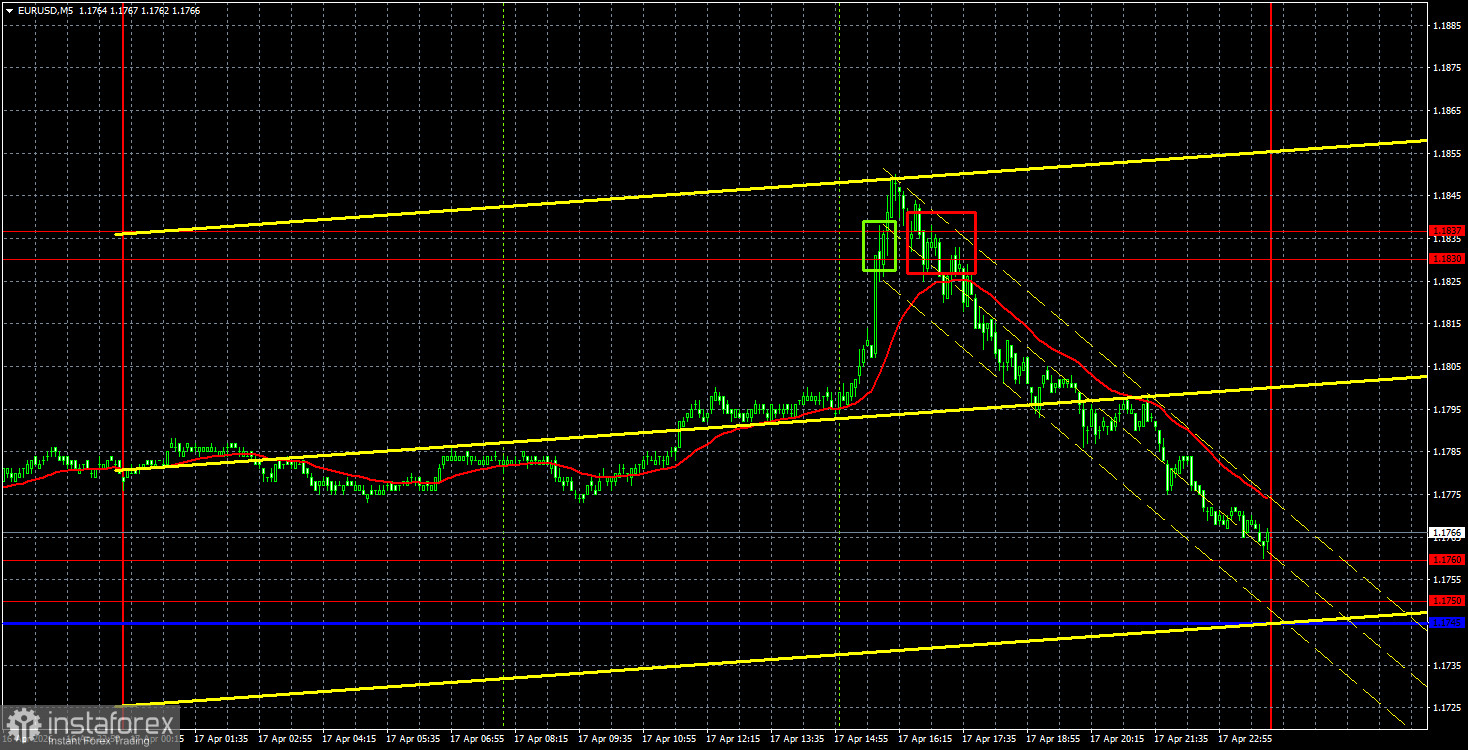
The EUR/USD currency pair moved in a completely predictable direction until the evening on Friday. In the first half of the day, with no macroeconomic or fundamental information, volatility was zero, and the market moved sideways. As evening approached, information about the reopening of the Strait of Hormuz came in, triggering a decline in the US dollar. Towards the end of the day and week, the pair plummeted by 90 pips, for which there seems to be no logical explanation at first glance. Nevertheless, we can hypothesize that the market has exhausted its positivity regarding the agreement between Iran and the US, the ceasefire in the Middle East, and the reopening of the Strait of Hormuz. The dollar fell for two consecutive weeks and, as we have established, every fairy tale eventually comes to an end.
From a technical perspective, the pair remains in an upward trend on the hourly timeframe, as evidenced by the trend line and the price's location above the critical Kijun-sen line and the 1.1750-1.1760 area. However, most likely we will see a new decline this week, at least a corrective one. The events of Friday were very interesting, but two days have passed since then, during which Iran managed to close the Strait of Hormuz again, and the situation between the US and Iran has once again escalated to the brink. Thus, Donald Trump announced his readiness to resume military operations in the region if the next round of negotiations fails. As we warned, a temporary ceasefire is absolutely not a guarantee of sustainable peace.
On the 5-minute timeframe, two trading signals were formed on Friday. First, the pair overcame the area 1.1830-1.1837; however, this signal proved to be blatantly false. But the next sell signal allowed traders not only to recover all losses from the first trade but to remain in the profit by the end of the day.
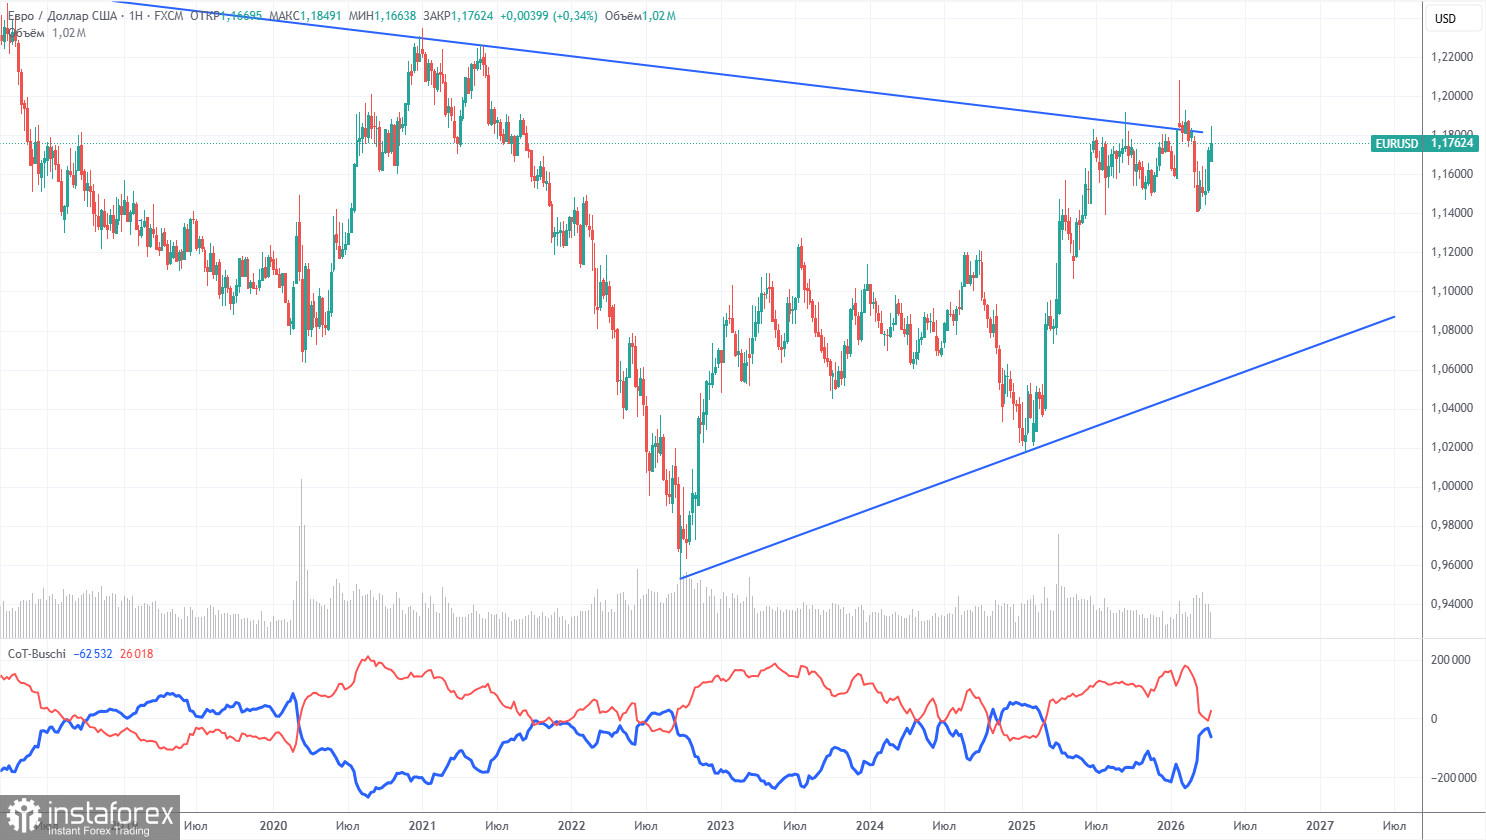
The latest COT report is dated April 14. The illustration on the weekly timeframe clearly shows that the net position of non-commercial traders remains "bullish," but is rapidly declining amid geopolitical events. Traders are dumping the euro in favor of the US dollar. Donald Trump's policy has not changed, but the dollar is currently acting as a "reserve currency," which ensures high demand for it.
We still do not see any fundamental factors that would strengthen the euro, while there are still enough factors that would weaken the American dollar. The war in the Middle East made the dollar temporarily super-attractive, but when this factor reaches its "expiration date," everything will return to normal. In the long term, the euro could fall to the level of 1.06$ (the trend line), but the upward trend will still remain relevant. Currently, the pair has not moved significantly away from the descending trend line, which has been broken several times.
The location of the red and blue lines of the indicator indicates parity between the bulls and bears. During the last reporting week, the number of longs in the "Non-commercial" group increased by 13,700, while the number of shorts decreased by 19,900. Accordingly, the net position increased by 33,600 contracts in just one week.
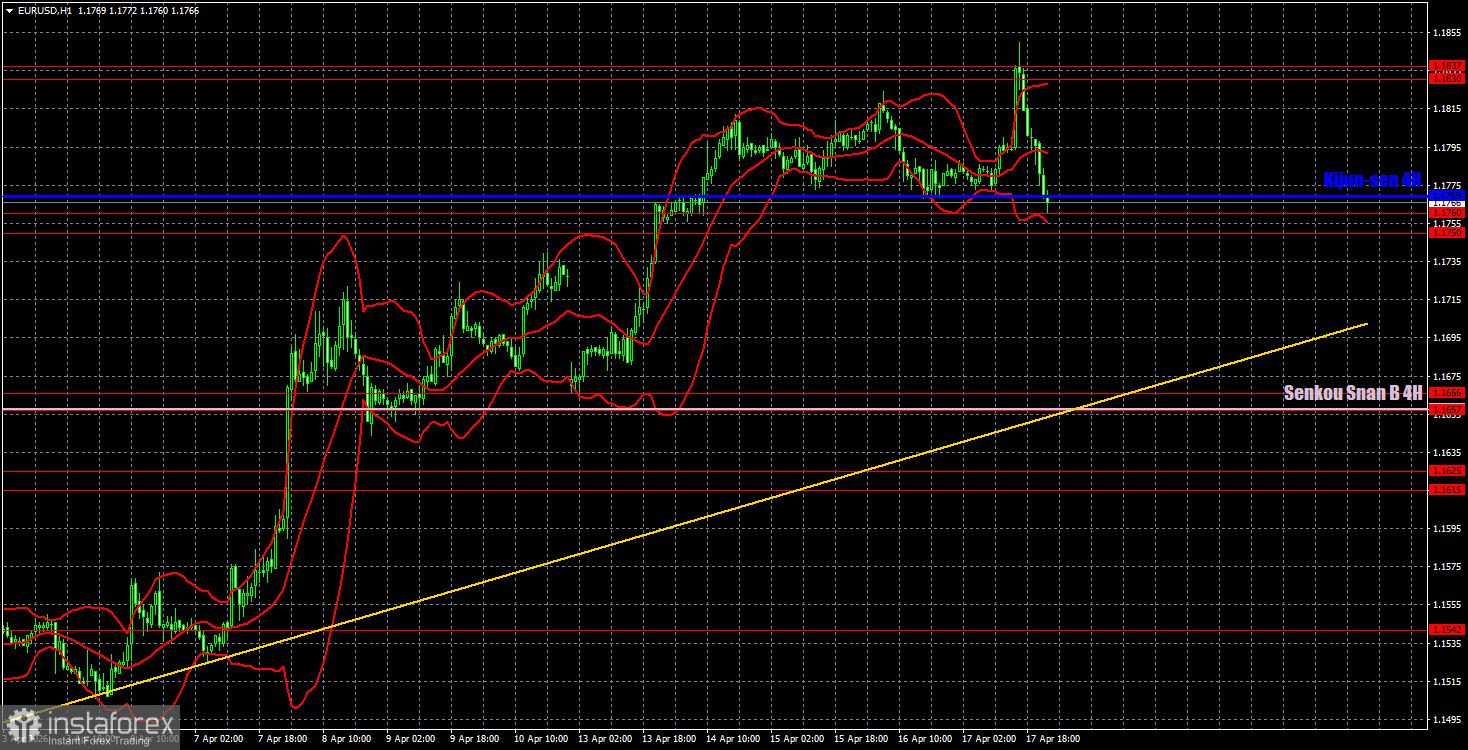
On the hourly timeframe, the EUR/USD pair continues to form an upward trend. A new escalation in the Middle East may again shift traders' trading priorities; therefore, a noticeable decline is quite possible in the new week. The situation in the Middle East remains tense but is not worsening, so there are also a few strong reasons for the US dollar to strengthen further. There are no technical reasons to expect the pair to drop below the level of 1.1400.
For April 20, we highlight the following levels for trading — 1.1362, 1.1426, 1.1542, 1.1615-1.1625, 1.1657-1.1666, 1.1750-1.1760, 1.1830-1.1837, 1.1907-1.1922, as well as the lines of Senkou Span B (1.1658) and Kijun-sen (1.1769). The lines of the Ichimoku indicator may shift during the day, which should be taken into account when determining trading signals. Do not forget to set a Stop Loss order to break even if the price has moved in the correct direction by 15 pips. This will protect against potential losses if the signal turns out to be false.
On Monday, there will be another speech by ECB President Christine Lagarde in the European Union, who will surely comment on the latest developments in the Middle East and in relations between Iran and the US. In the States, the event calendar is completely empty. Geopolitics will again come to the forefront after the events of Saturday and Sunday.
On Monday, traders may consider short positions if the price settles below the 1.1750-1.1760 area, targeting 1.1657-1.1666. Long positions can be opened upon a bounce from the area of 1.1750-1.1760, targeting 1.1830-1.1837.
Price levels of support and resistance – thick red lines, around which the movement may end. They are not sources of trading signals.
Kijun-sen and Senkou Span B lines – lines of the Ichimoku indicator that are carried over to the hourly timeframe from the 4-hour one. They are strong lines.
Extreme levels – thin red lines from which the price has previously bounced. They are sources of trading signals.
Yellow lines – trend lines, trend channels, and any other technical patterns.
Indicator 1 on COT charts – the size of the net position of each category of traders.
Díky analytickým přehledům společnosti InstaForex získáte plné povědomi o tržních trendech! Jako zákazníkovi společnosti InstaForex je Vám k dispozici velký počet bezplatných služeb umožňujících efektivní obchodování.


