 Zůstat
Obchodní podmínky
Nástroje


Měnový pár EUR/USD v pondělí nevykazoval žádné zajímavé pohyby. Den začal mírným poklesem, nicméně v průběhu dne kotace rostly. Je důležité poznamenat, že klíčovou událostí dne bylo zrušení druhého kola jednání mezi USA a Íránem, což znamená, že Hormuzský průliv zůstává blokován z obou stran a válka na Blízkém východě by mohla ve středu pokračovat, jelikož v tento den vyprší dvoutýdenní příměří. Zdálo se, že trh má všechny potřebné důvody k obnovení nákupů bezpečného dolaru. Trh však na tuto událost sotva reagoval, což nás vede k domněnce, že geopolitický faktor nadále ztrácí na významu. To samozřejmě neznamená, že již neuvidíme reakce trhu na události na Blízkém východě – v případě obnovení rozsáhlého konfliktu by dolar mohl výrazně posílit. Celkově však trh již není připraven se slepě vrhat do nákupů americké měny.
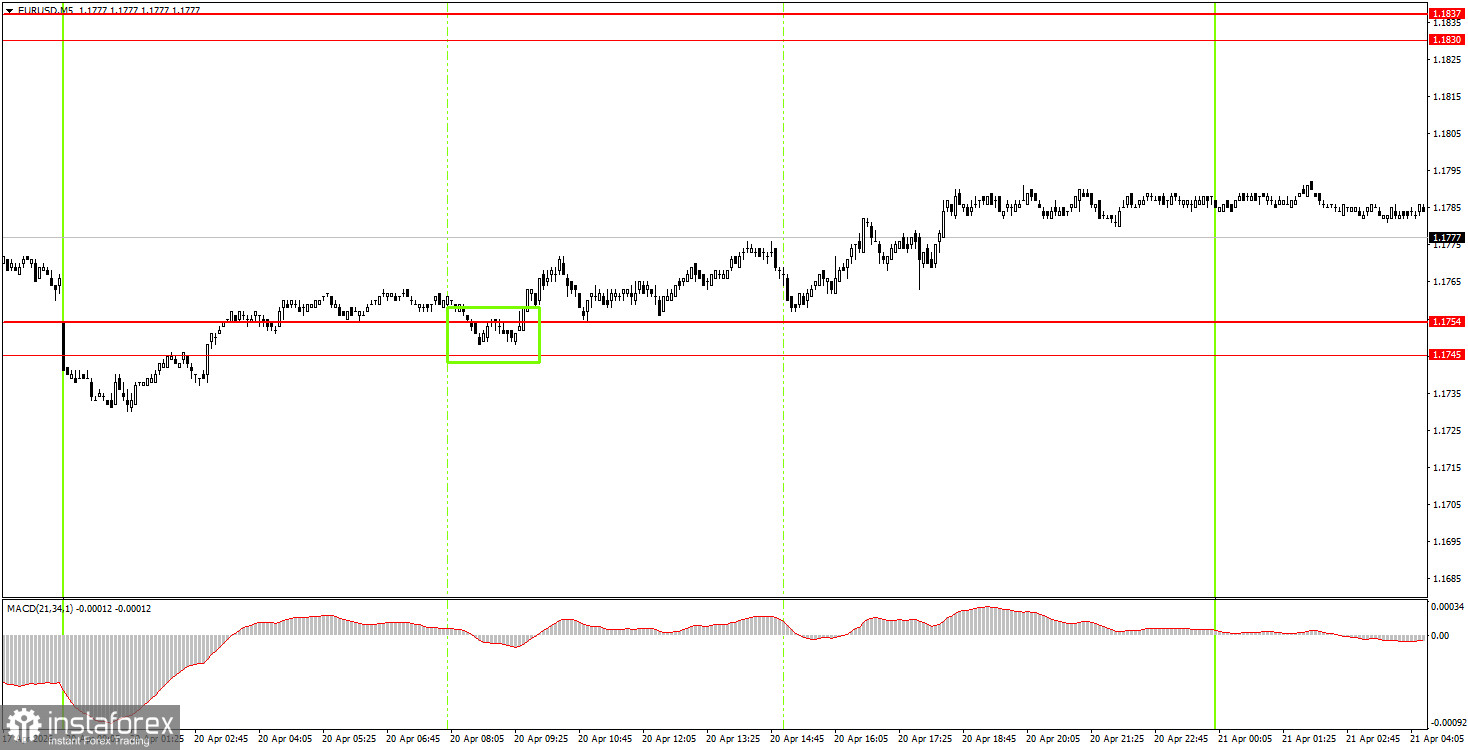
V 5minutovém časovém rámci byl v pondělí vygenerován pouze jeden obchodní signál – signál k nákupu. Na samém začátku evropské obchodní seance se cena odrazila od oblasti 1,1745–1,1754 a pokračovala v pohybu pouze jedním směrem – nahoru. Do konce dne tak mohli začínající obchodníci ručně uzavřít dlouhou pozici se ziskem asi 20 pipsů.
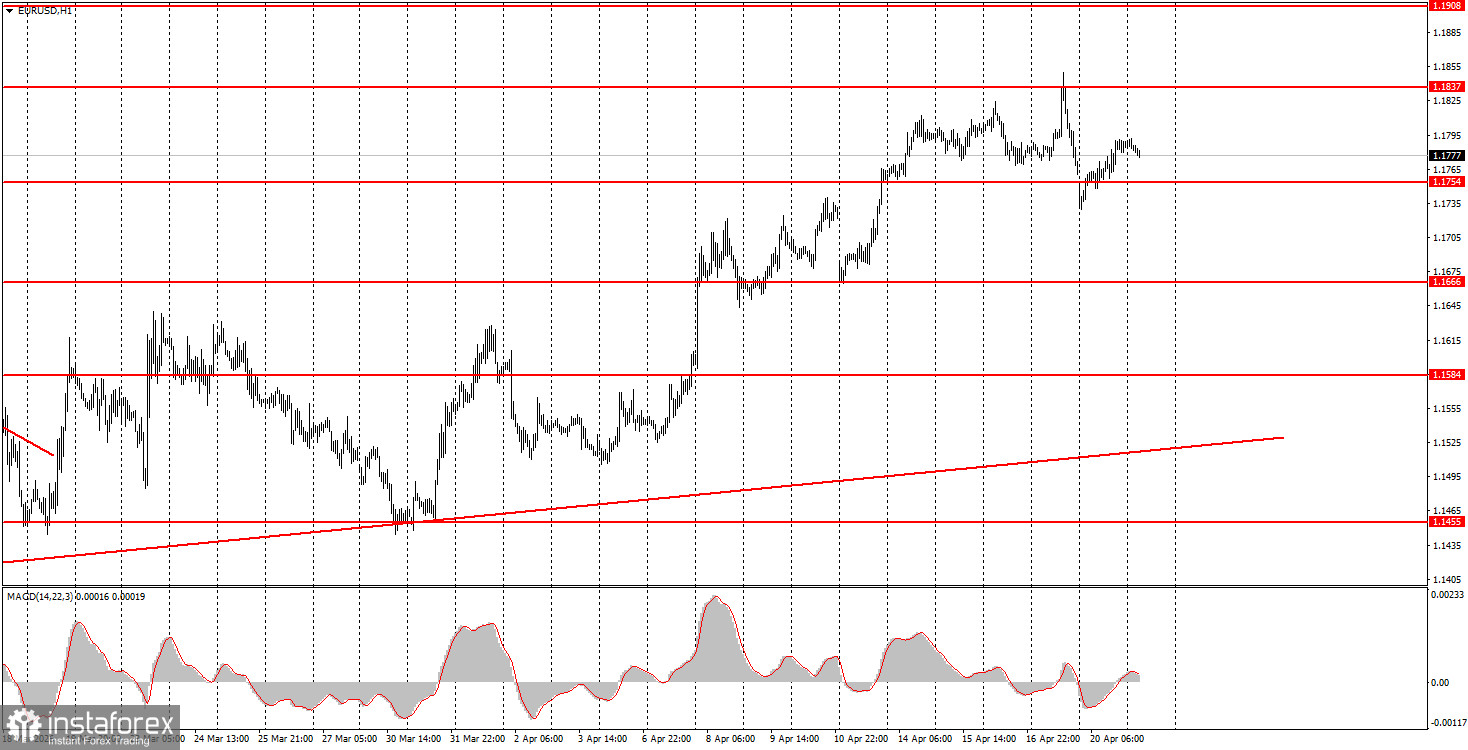
V hodinovém časovém rámci zůstává vzestupný trend zachován. Dva týdny po sobě trh dolar prodával a geopolitické faktory poněkud ztratily na významu. Geopolitika se však opět zhoršuje, takže tento týden by americký dolar jako bezpečné aktivum mohl být opět žádaný. Domníváme se, že korekce je možná, ale v každém případě musí obchodníci pracovat s technickými úrovněmi a pohyby budou záviset na vývoji na Blízkém východě.
V úterý mohou začínající obchodníci zvážit krátké pozice, pokud se cena ustálí pod oblastí 1,1745–1,1754 s cílem v oblasti 1,1655–1,1666. Nové nákupy lze zvážit po odrazu od oblasti 1,1745–1,1754 s cílem v oblasti 1,1830–1,1837.
Na 5minutovém časovém rámci je třeba sledovat úrovně 1,1354–1,1363, 1,1413, 1,1455–1,1474, 1,1527–1,1531, 1,1584–1,1591, 1,1655–1,1666, 1,1745–1,1754, 1,1830–1,1837, 1,1899–1,1908. V úterý bude v eurozóně zveřejněn pouze index ekonomických očekávání ZEW, zatímco v USA by měla být zveřejněna týdenní zpráva ADP o zaměstnanosti a údaje o maloobchodních tržbách. Je nepravděpodobné, že by všechny čtyři zprávy vyvolaly významnou reakci trhu.
Díky analytickým přehledům společnosti InstaForex získáte plné povědomi o tržních trendech! Jako zákazníkovi společnosti InstaForex je Vám k dispozici velký počet bezplatných služeb umožňujících efektivní obchodování.


