 Zůstat
Obchodní podmínky
Nástroje


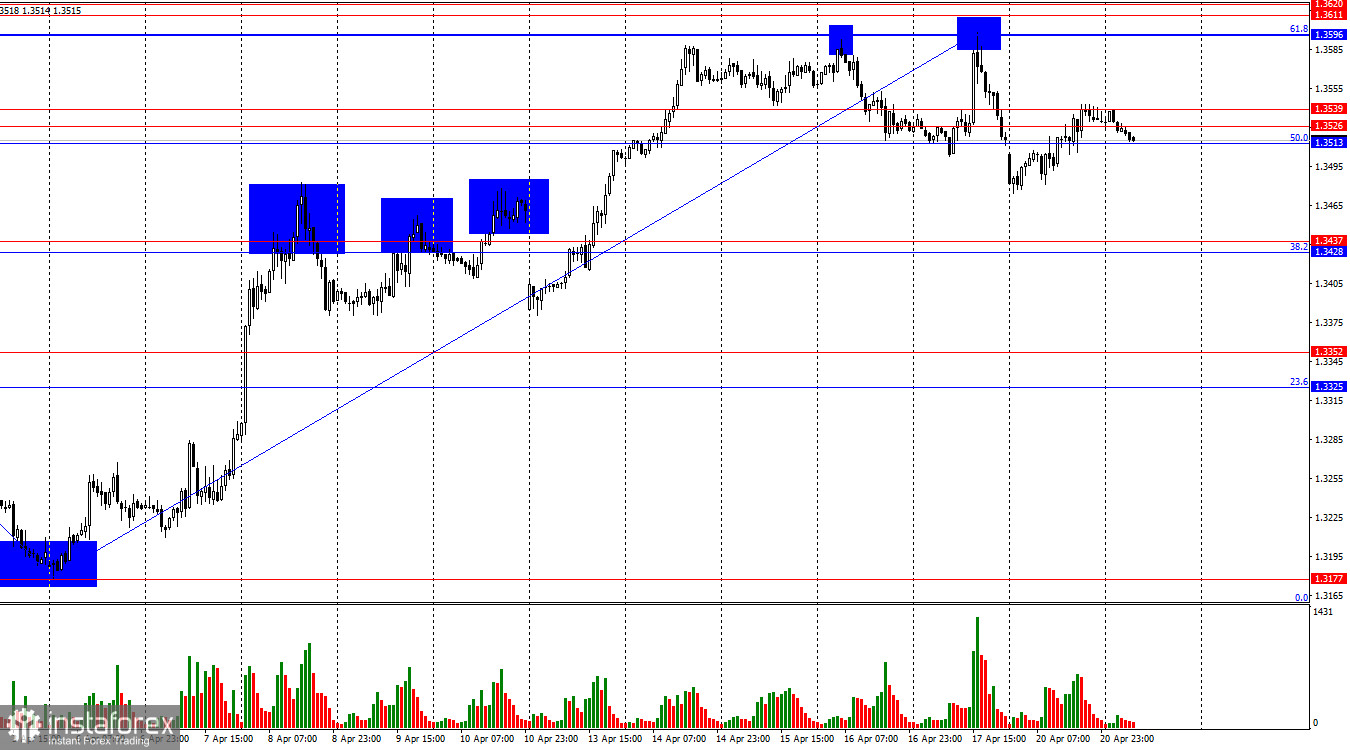
On the hourly chart, the GBP/USD pair on Monday returned to the resistance level of 1.3513–1.3539. A rebound from this zone on Tuesday will favor the US dollar and a resumption of the decline toward the support level of 1.3428–1.3437. A consolidation above the 1.3513–1.3539 level will allow traders to expect a move back to the resistance level of 1.3596–1.3620.
The wave situation remains "bullish." The latest upward wave broke the previous peak, while the last completed downward wave did not break the previous low. Geopolitics gave the bears almost complete dominance in the market for two months, after which the geopolitical background supported the bulls for two weeks. At present, the situation in the Middle East risks escalating again, so the bears feel more confident. However, the geopolitical vector can change at any moment. For now, bulls still dominate the market.
The information backdrop on Monday was important, but traders chose to ignore it. Otherwise, the US dollar would have shown strong growth. Traders are increasingly deciding not to rush to conclusions, as geopolitical news often changes rapidly. As recently as Friday, the market welcomed the reopening of the Strait of Hormuz, but as of Tuesday, the strait is closed, negotiations between the US and Iran have been canceled, and war could resume as early as today or tomorrow. The situation with oil remains complex despite a decline in its price over the past few days. Citigroup warns that by the end of June, global crude oil inventories will fall to their lowest level in eight years. If traffic through the Strait of Hormuz is not restored, $110 per barrel will be the minimum price. The global oil deficit will increase to 1.3 billion barrels if the strait remains blocked for another month. If a truce is signed and the strait is unblocked, oil production and transportation will begin to gradually recover in May. Extending the blockade of the strait for two months would push oil prices up to $130 per barrel.
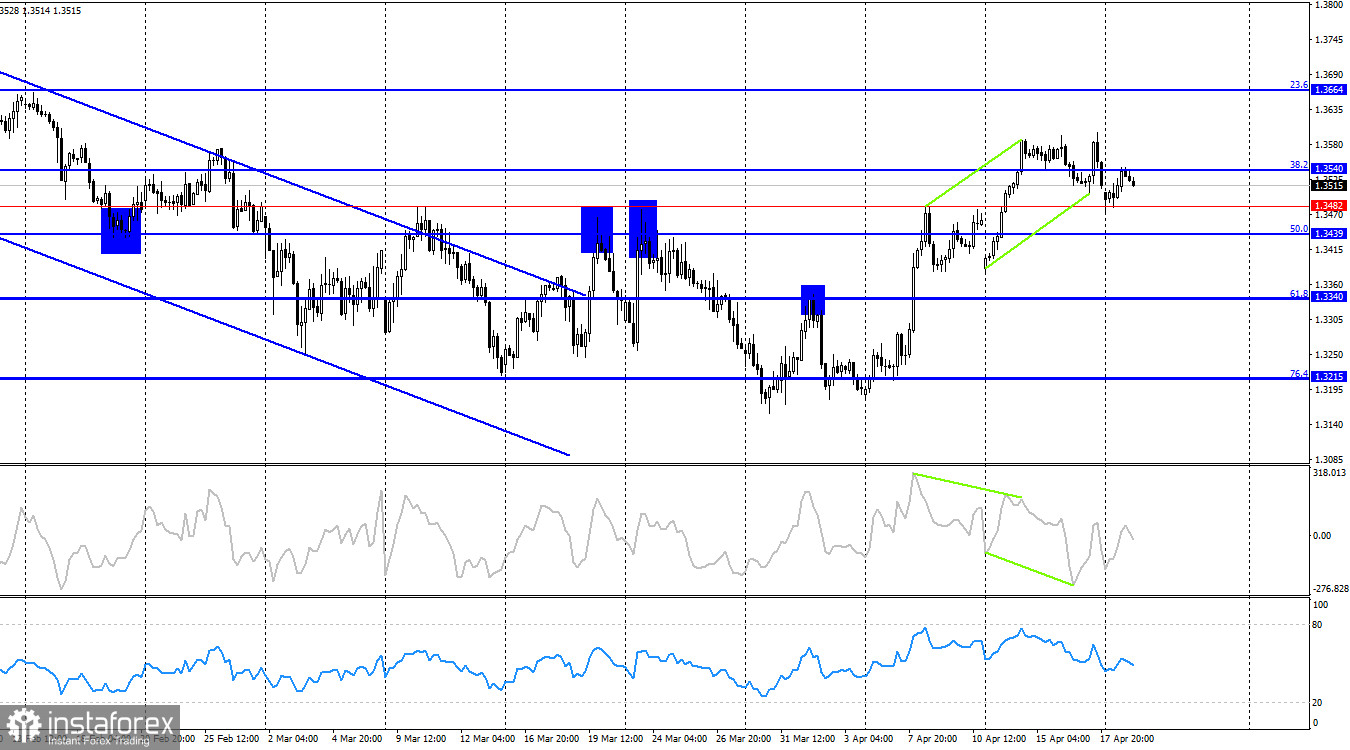
On the 4-hour chart, the pair consolidated above a descending trend channel, which allows for expectations of a full-fledged trend. After the formation of a "bearish" divergence on the CCI indicator, the pair reversed in favor of the US dollar and consolidated below the 38.2% retracement level at 1.3540. Thus, the decline may continue toward the levels of 1.3482 and 1.3439. However, the chart pattern on the hourly timeframe is currently clearer, so I recommend relying on it. No new emerging divergences are observed today.
Commitments of Traders (COT) report:
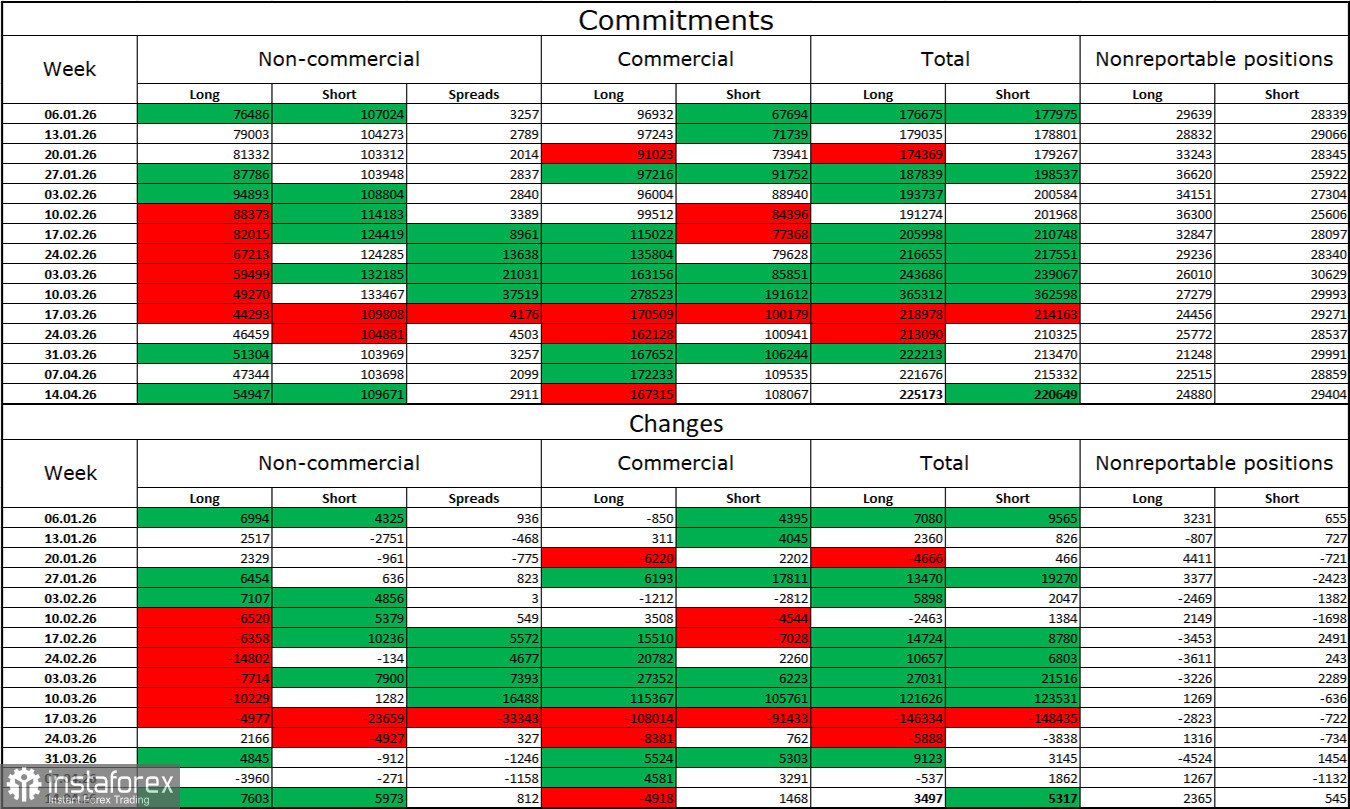
The sentiment of the "Non-commercial" category of traders became less bearish over the last reporting week. The number of long positions held by speculators increased by 7,603, while the number of short positions increased by 5,973. The gap between long and short positions is now effectively 55 thousand versus 110 thousand. For six consecutive weeks, non-commercial traders actively increased selling and reduced buying, which led to a strong imbalance between long and short positions. In recent weeks, bears have dominated, which is unsurprising given the geopolitical situation.
I still do not believe in a sustained bearish trend for the British pound, but now everything depends not on economic indicators, Trump's trade policy, or central bank monetary policy, but on the duration, scale, and consequences of the war in the Middle East. In recent weeks, the market had shifted toward expectations of de-escalation, but the latest news suggests that a full truce is still far off, and war could resume at any time. In that case, the bears' advantage could become even stronger.
Economic calendar for the US and the UK:
On April 21, the economic calendar includes five entries, with UK reports drawing particular interest. The information backdrop may influence market sentiment on Tuesday.
GBP/USD forecast and trader tips:
Selling the pair is possible today upon a rebound from the 1.3513–1.3539 level on the hourly chart, targeting 1.3428–1.3437. Buying is possible upon consolidation above the 1.3513–1.3539 level, targeting 1.3596–1.3620.
Fibonacci levels are drawn from 1.3866–1.3158 on the hourly chart and from 1.3012–1.3868 on the 4-hour chart.
Díky analytickým přehledům společnosti InstaForex získáte plné povědomi o tržních trendech! Jako zákazníkovi společnosti InstaForex je Vám k dispozici velký počet bezplatných služeb umožňujících efektivní obchodování.


