 Zůstat
Obchodní podmínky
Nástroje


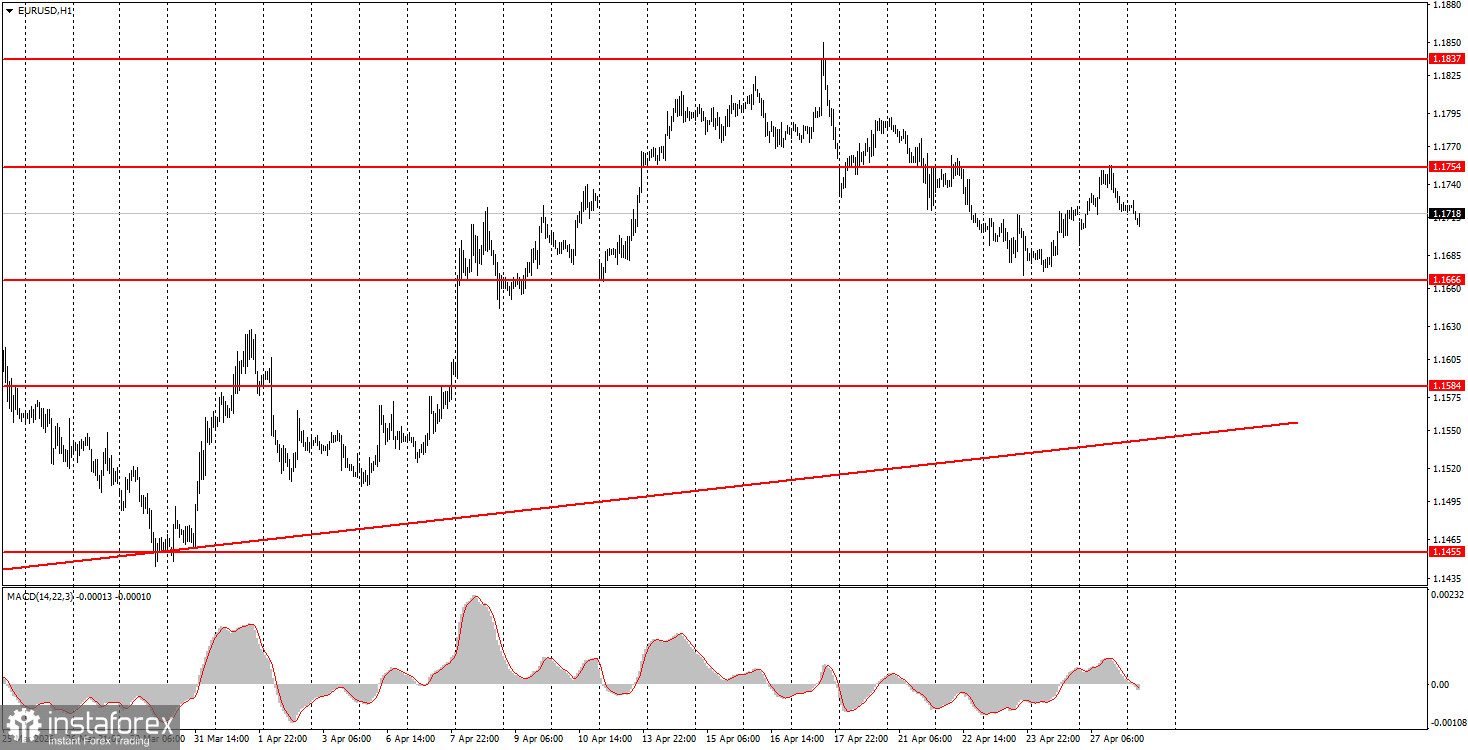
On Monday, the EUR/USD currency pair traded higher but failed to break above the nearest resistance level at 1.1754. Therefore, a new round of correction within the ongoing upward trend, supported by the trend line, may begin this week. Overall, there were absolutely no news updates on Monday: no macroeconomic, fundamental, or geopolitical news. Thus, the pair's movements during the day were purely technical. However, it is worth noting that a large number of important events are scheduled for later this week, and geopolitical news tends to break at the most unexpected moments. Speaking of the nature of geopolitical events, it is also impossible to predict what the next move will be from Trump or Tehran. Currently, unofficial negotiations continue, but both sides are standing firm and making offers that clearly do not appeal to the opposing party.
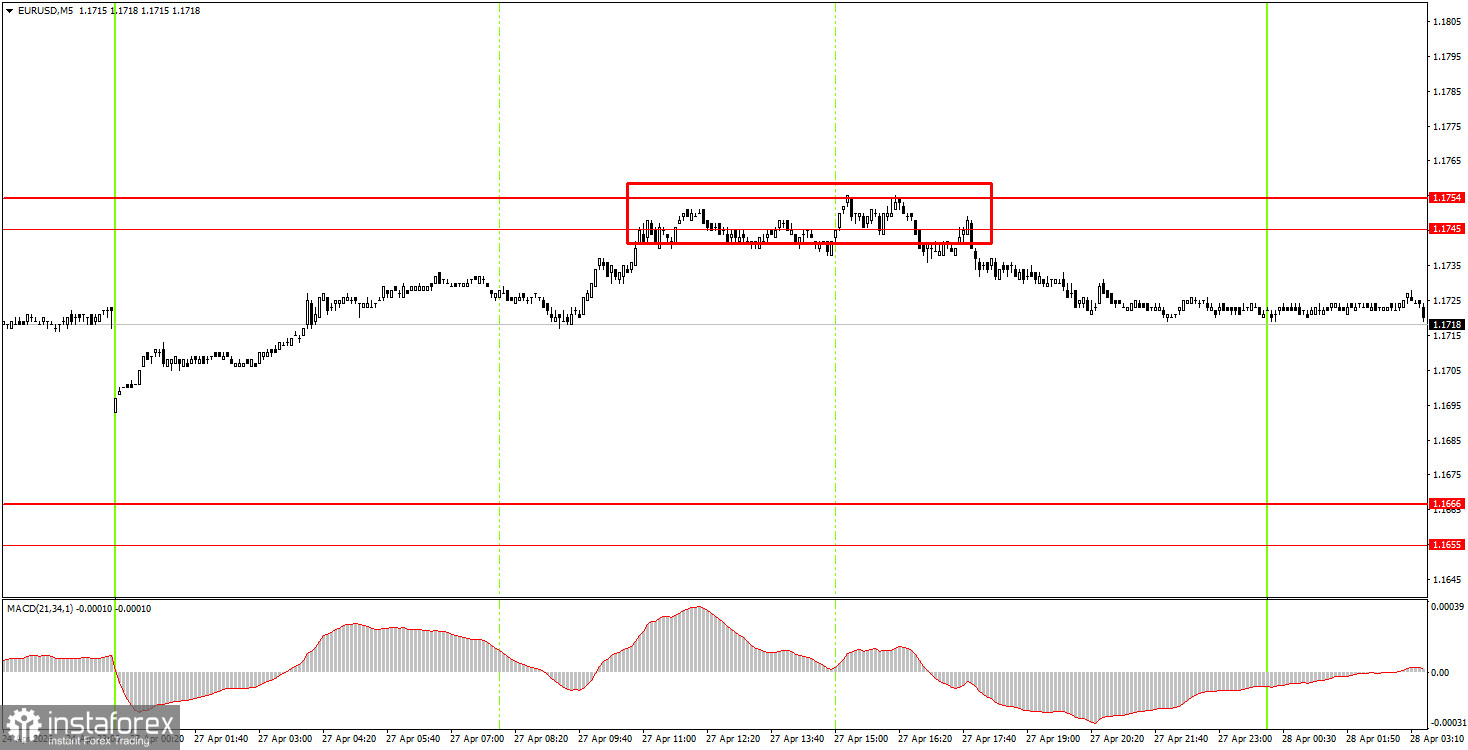
On the 5-minute timeframe, one trading signal was formed on Monday. During the American trading session, after five hours of struggles, the pair finally bounced from the area of 1.1745-1.1754, prompting a minor decline on Monday, but the downward movement may continue into Tuesday.
On the hourly timeframe, the upward trend remains intact. For two consecutive weeks, the market has sold off the dollar, while geopolitical factors have receded somewhat into the background. However, the geopolitical situation is not improving, and in the near term, the U.S. dollar may be in demand as a safe-haven asset. That said, it is probably unrealistic to expect a strong strengthening of the dollar.
On Tuesday, beginner traders may remain in short positions targeting 1.1655-1.1666, as a sell signal was formed in the 1.1745-1.1754 area yesterday. New long positions can be considered if the price consolidates above the 1.1745-1.1754 area, targeting 1.1830-1.1837.
On the 5-minute timeframe, the levels to consider for trading include 1.1354-1.1363, 1.1413, 1.1455-1.1474, 1.1527-1.1531, 1.1584-1.1591, 1.1655-1.1666, 1.1745-1.1754, 1.1830-1.1837, and 1.1899-1.1908. On Tuesday, Christine Lagarde will be speaking in the Eurozone, but we do not expect her to share any important information with traders just two days before the European Central Bank meeting. There are no other scheduled events.
Price levels of support and resistance are levels that serve as targets when opening buys or sells. Take Profit levels can be placed around them.
Red lines represent channels or trend lines that show the current trend and indicate the direction in which it is preferable to trade now.
The MACD indicator (14,22,3) – the histogram and the signal line – is a supporting indicator that can also be used as a source of signals.
Important speeches and reports (always included in the news calendar) can significantly affect the movement of the currency pair. Therefore, during their release, trading should be done with utmost caution, or traders should exit the market to avoid sharp price reversals against the previous movement.
Beginning traders in the forex market should remember that not every trade can be profitable. Developing a clear strategy and effective money management are the keys to long-term trading success.
Díky analytickým přehledům společnosti InstaForex získáte plné povědomi o tržních trendech! Jako zákazníkovi společnosti InstaForex je Vám k dispozici velký počet bezplatných služeb umožňujících efektivní obchodování.


