 Zůstat
Obchodní podmínky
Nástroje


The GBP/USD pair also showed quite a good upward movement throughout Thursday, and on the 5-minute timeframe, it is evident that the movement intensified after the Bank of England meeting. Thus, the British central bank's meeting was essentially the only event yesterday that the market reacted to. It cannot be said that the meeting's results were unequivocally "hawkish." The central bank kept the key rate unchanged, and the results of the Monetary Policy Committee's voting on the rate aligned with forecasts. There were no promises to necessarily raise the key rate in the future. However, the market still considered the probability of monetary policy tightening in Europe or the UK due to high inflation to be higher than in the US, which supported the euro and the pound. Overall, European currencies should rise even without this factor. The dollar lacks any fundamental basis for medium-term growth.
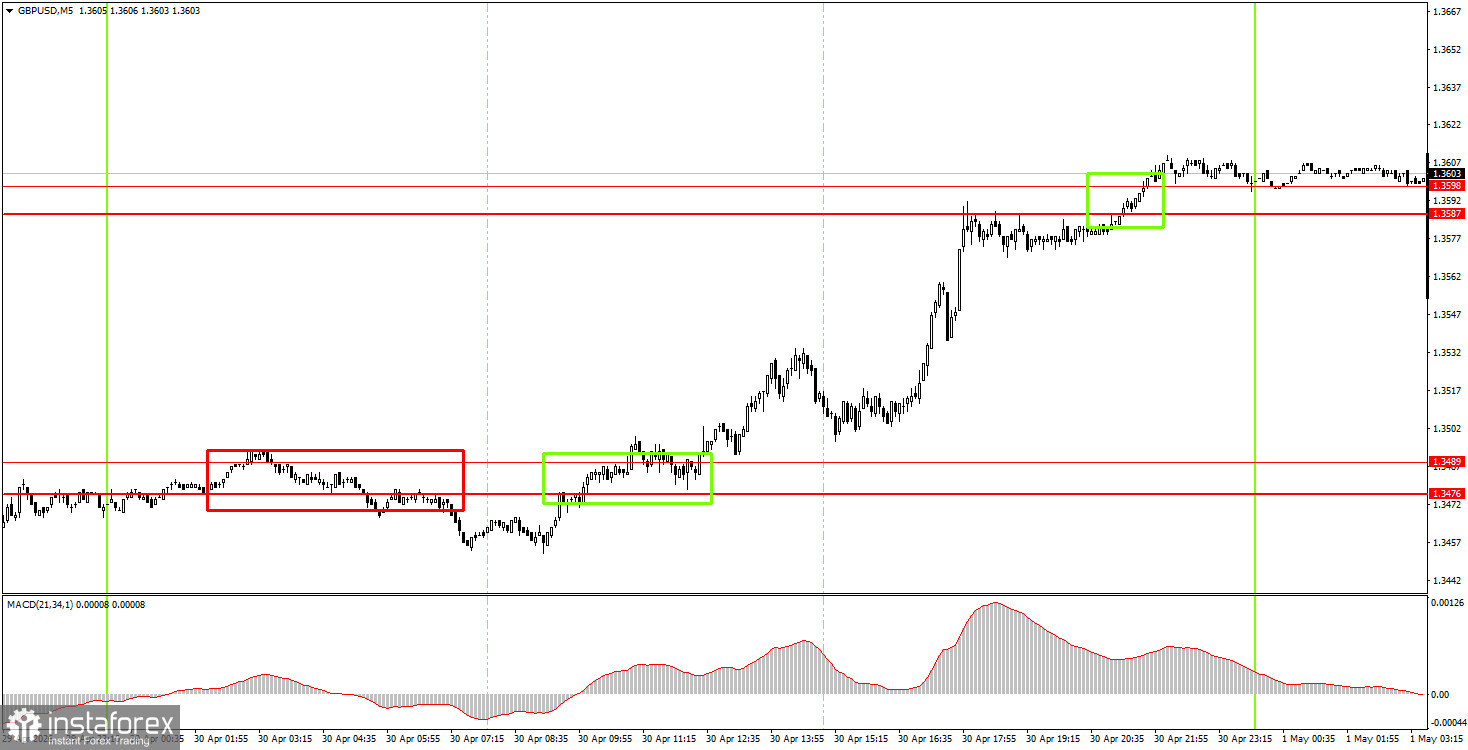
On the 5-minute timeframe, three trading signals were formed on Thursday. The day began with a false breakout of the price below the area of 1.3476-1.3489, but the next buy signal proved correct. By the end of the day, the British pound rose to the nearest target – the area of 1.3587-1.3598 and broke through it. Thus, the long position brought at least 75 pips in profit.
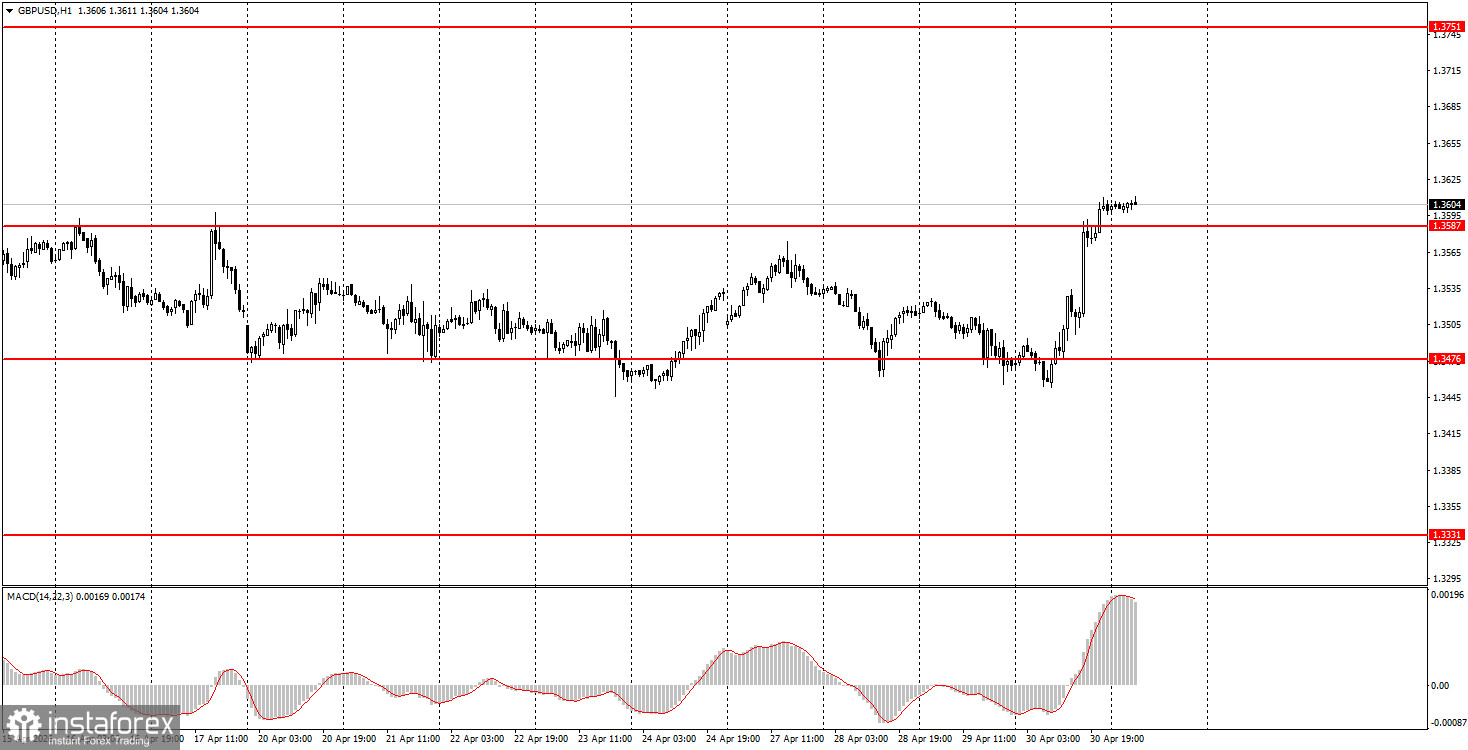
On the hourly timeframe, the GBP/USD pair continues to form an upward trend, but for the past two weeks, it has been trading in a flat. There are still no global grounds for medium-term dollar growth, so we expect the resumption of the upward trend seen in 2025 in 2026. Without a significant escalation in the Middle East, the dollar will no longer be able to sustain the growth it has shown over the last two months. Individual events may still provoke their strengthening, but overall, the geopolitical factor has taken a backseat.
On Thursday, beginner traders may open short positions if the price consolidates below 1.3587-1.3598 with a target of 1.3476-1.3489. If it consolidates above the 1.3587-1.3598 area, new long positions can be opened targeting 1.3695.
On the 5-minute timeframe, levels to trade are now 1.3175-1.3180, 1.3259-1.3267, 1.3319-1.3331, 1.3380-1.3386, 1.3476-1.3489, 1.3587-1.3598, 1.3695, 1.3741-1.3751. Today, the UK has an empty events calendar, while in the US, a fairly important ISM Manufacturing Index will be released.
Price levels (areas) of support and resistance – levels that are targets when opening purchases or sales, or sources of signals.
Red lines – channels or trend lines that display the current trend and indicate which direction is preferable to trade now.
MACD indicator (14, 22, 3) – histogram and signal line – a supporting indicator that can also be used as a source of signals.
Important speeches and reports (contained in the news calendar) can significantly influence the movement of the currency pair. Therefore, during their release, trading should be done as cautiously as possible, or one should exit the market to avoid a sharp price reversal against the preceding movement.
Beginners trading in the Forex market should remember that not every trade can be profitable. Developing a clear strategy and sound money management are key to long-term trading success.
Díky analytickým přehledům společnosti InstaForex získáte plné povědomi o tržních trendech! Jako zákazníkovi společnosti InstaForex je Vám k dispozici velký počet bezplatných služeb umožňujících efektivní obchodování.


