 Zůstat
Obchodní podmínky
Nástroje


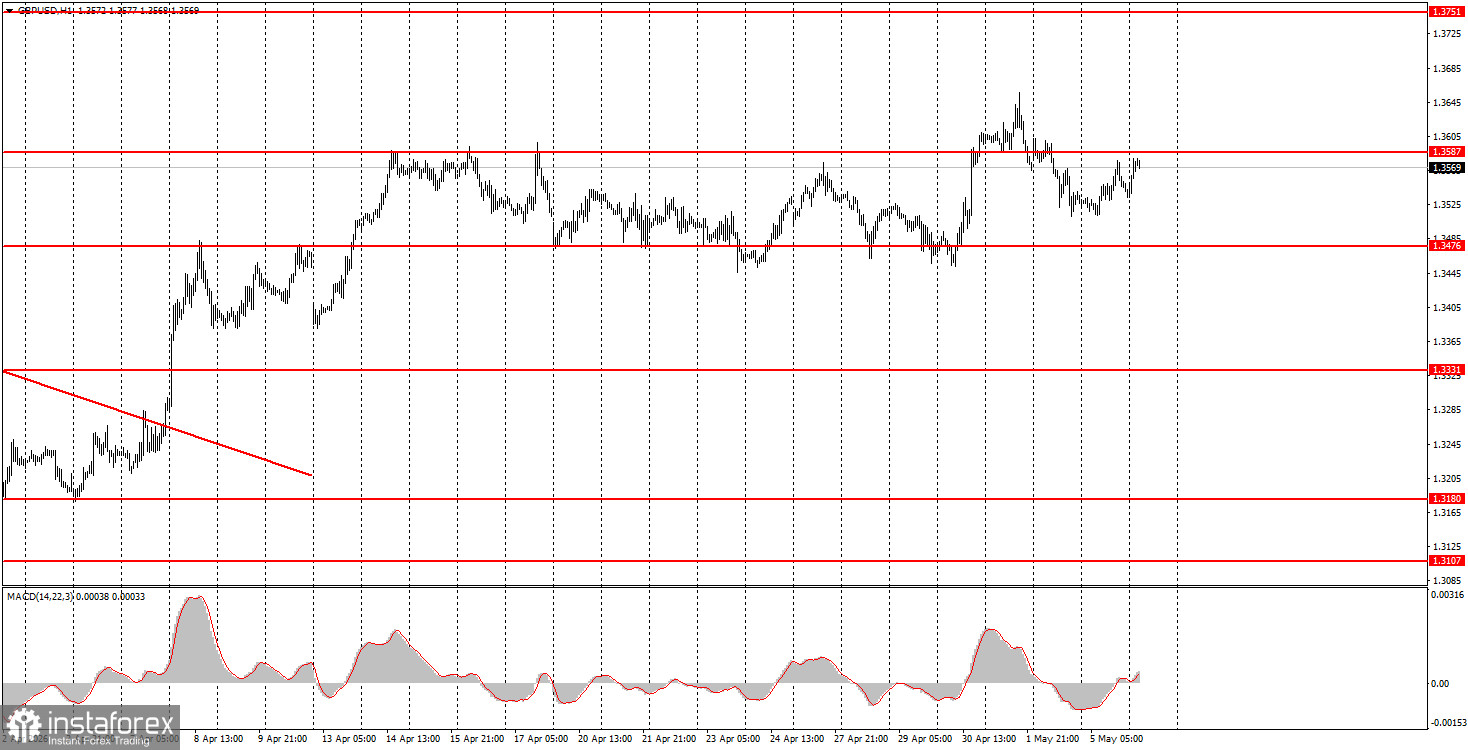
The GBP/USD pair also did not show any interesting "movements" on Tuesday. Despite the fact that Iran continued to bombard the UAE and two quite interesting reports were published in the US, the market found no grounds for active actions. The ISM Services PMI for April was slightly weaker than expected, but the dollar's decline began during the European trading session. The JOLTs report on job openings was roughly in line with forecast values. Thus, the British currency traded higher for most of the day solely on technical factors. The hourly timeframe clearly shows a flat range between 1.3476 and 1.3587, which has persisted for three weeks. Last week, the price left the sideways channel, but it later turned out to be merely a return to it the very next day. The market is awaiting a resolution in the Middle East and labor market and unemployment data from the US.
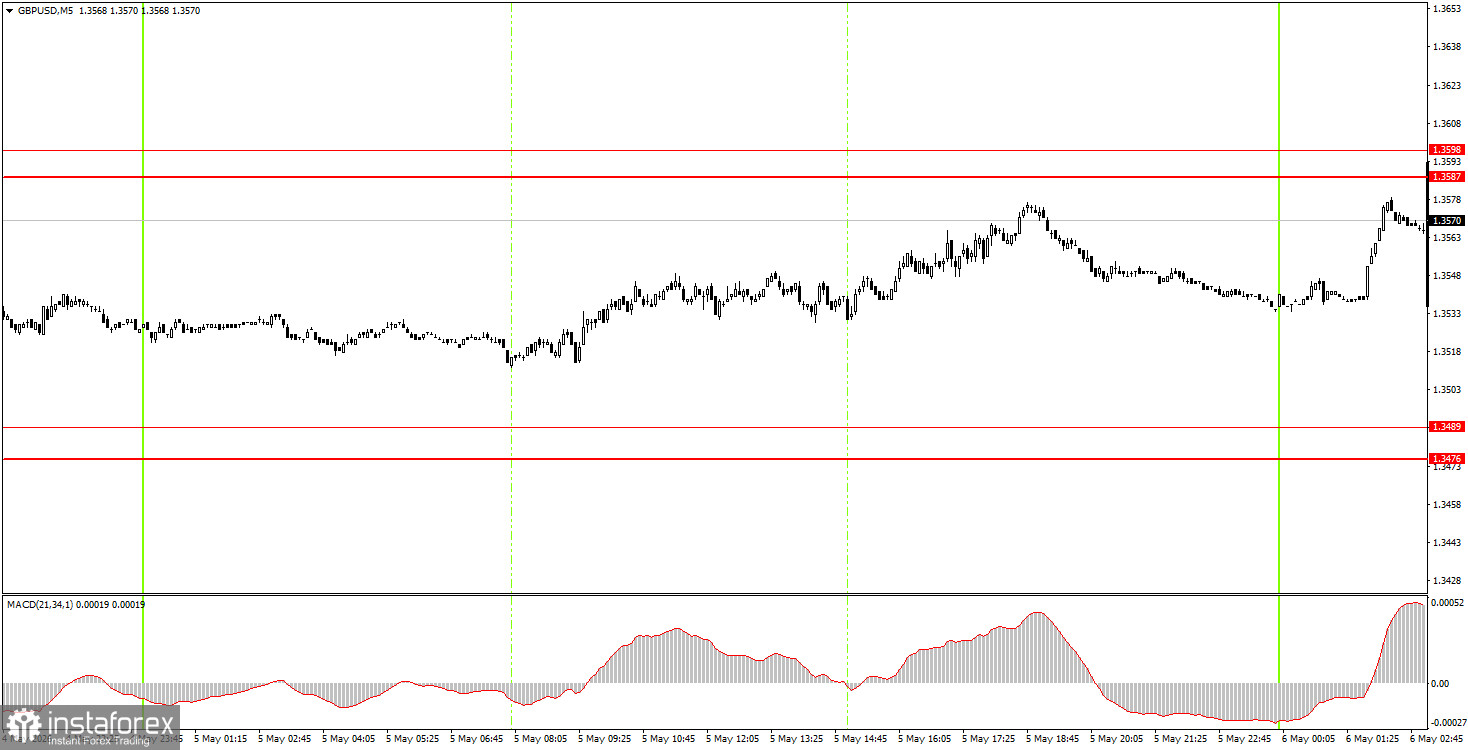
On the 5-minute timeframe on Tuesday, no trading signals were generated. Only in the evening did the pair approach the area 1.3587-1.3598, but it could not work it out. Thus, there were also no grounds for opening trades on the British pound on Tuesday.
On the hourly timeframe, the GBP/USD pair maintains an upward trend but has been trading in a sideways channel for the past three weeks. There are still no major grounds for mid-term dollar growth, even with the possible renewal of the conflict in the Middle East. Therefore, we expect the upward trend to resume in 2026. Without a serious escalation in the Middle East, the dollar will no longer be able to sustain the growth it showed in February-March. Individual events may still provoke their strengthening, but the overall geopolitical factor has taken a back seat.
On Wednesday, beginner traders can open short positions in case of a bounce from the area of 1.3587-1.3598 with a target of 1.3476-1.3489. A price consolidation above the 1.3587-1.3598 area will signal long positions with a target at 1.3695.
On the 5-minute timeframe, trading can now be done at the levels of 1.3175-1.3180, 1.3259-1.3267, 1.3319-1.3331, 1.3380-1.3386, 1.3476-1.3489, 1.3587-1.3598, 1.3695, 1.3741-1.3751. Today, the UK calendar of events is completely empty, and in the US, only the ADP report on private-sector employment changes will be released. This report is an analog of the Non-Farm Payrolls but is less important.
Price levels (areas) of support and resistance – levels that are targets when opening purchases or sales, or sources of signals.
Red lines – channels or trend lines that display the current trend and indicate which direction is preferable to trade now.
MACD indicator (14, 22, 3) – histogram and signal line – a supporting indicator that can also be used as a source of signals.
Important speeches and reports (contained in the news calendar) can significantly influence the movement of the currency pair. Therefore, during their release, trading should be done as cautiously as possible, or one should exit the market to avoid a sharp price reversal against the preceding movement.
Beginners trading in the Forex market should remember that not every trade can be profitable. Developing a clear strategy and sound money management are key to long-term trading success.
Díky analytickým přehledům společnosti InstaForex získáte plné povědomi o tržních trendech! Jako zákazníkovi společnosti InstaForex je Vám k dispozici velký počet bezplatných služeb umožňujících efektivní obchodování.


