 Zůstat
Obchodní podmínky
Nástroje


Bitcoin was quickly brought back down to earth after reaching $82,400, and is now trading around $81,000. Ethereum has also declined significantly following a brief surge in buying activity observed during today's Asian trading session.

According to recent data, inflows into spot BTC ETFs have stagnated since early May, diminishing market optimism. Total inflows into spot Bitcoin ETFs have decreased, contrasting sharply with the nearly continuous growth seen in April. This data suggests a potential slowdown in the bullish momentum that supported the digital asset market last month. While the inflow of funds into spot BTC ETFs in April was impressive, the current stagnation may indicate that this inflow has peaked or exhausted its initial momentum.
Amid this trend, the overall trading volume in cryptocurrency on spot markets of centralized exchanges dropped to a record low in April over the past 25 months. Such a significant decline in trading activity is considered a bearish signal, suggesting decreased trader interest and possibly the approach of a corrective phase in the market. The lower trading volumes on centralized exchanges in April may be due to various factors, including concerns about the geopolitical situation and reduced risk appetite. However, the combination of these two trends—stagnation in ETF inflows and falling trading volumes—raises legitimate concerns about the future price dynamics of cryptocurrencies.
Regarding the intraday strategy in the cryptocurrency market, I will continue to act based on major pullbacks in Bitcoin and Ethereum, anticipating the long-term bullish market development that remains intact.
For short-term trading, the strategy and conditions are outlined below.
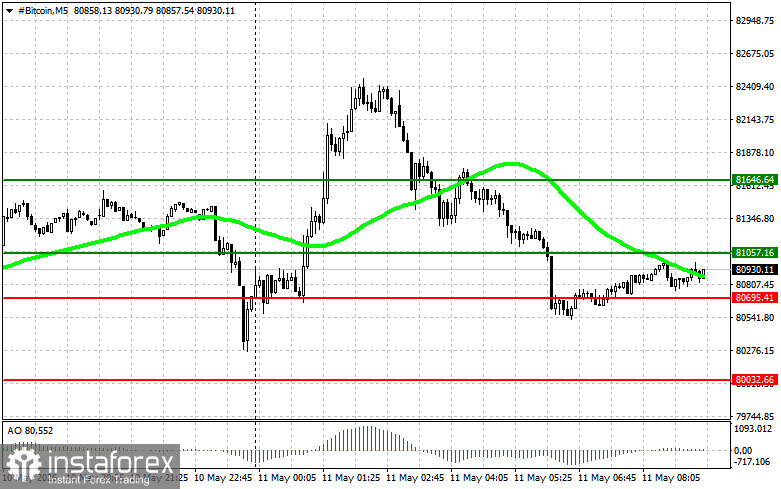
Scenario #1: I plan to buy Bitcoin today upon reaching the entry point around $81,000 with a target rise to the level of $81,600. At around $81,600, I will exit the buy trades and immediately sell on the bounce. Before buying on a breakout, make sure the 50-day moving average is below the current price and the Awesome indicator is in the positive zone.
Scenario #2: I can buy Bitcoin from the lower boundary of $80,700 if there is no market reaction to its breakout back towards the levels of $81,000 and $81,600.
Scenario #1: I plan to sell Bitcoin today upon reaching the entry point around $80,700 with a target drop to the level of $80,000. At around $80,000, I will exit the sell trades and immediately buy on the bounce. Before selling on a breakout, make sure the 50-day moving average is above the current price and the Awesome indicator is in the negative zone.
Scenario #2: I can sell Bitcoin from the upper boundary of $81,000 if there is no market reaction to its breakout back towards the levels of $80,700 and $80,000.
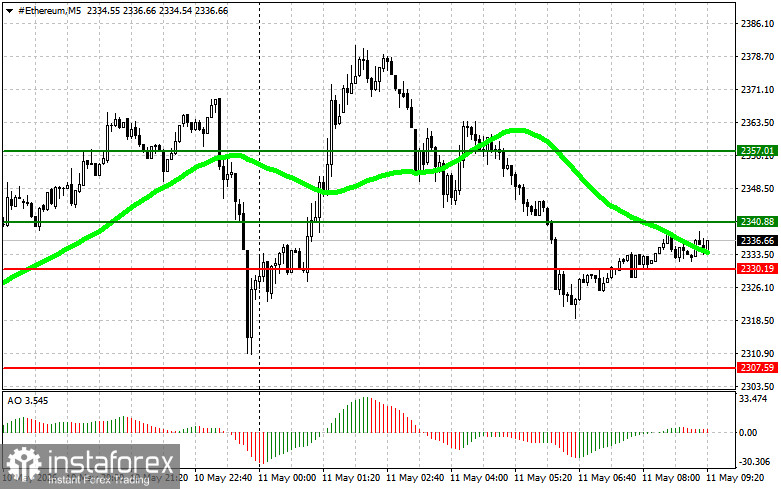
Scenario #1: I plan to buy Ethereum today upon reaching the entry point around $2,340 with a target rise to the level of $2,357. At around $2,357, I will exit the buy trades and immediately sell on the bounce. Before buying on a breakout, make sure the 50-day moving average is below the current price and the Awesome indicator is in the positive zone.
Scenario #2: I can buy Ethereum from the lower boundary of $2,330 if there is no market reaction to its breakout back towards the levels of $2,340 and $2,357.
Scenario #1: I plan to sell Ethereum today upon reaching the entry point around $2,330 with a target drop to the level of $2,307. At around $2,307, I will exit the sell trades and immediately buy on the bounce. Before selling on a breakout, make sure the 50-day moving average is above the current price and the Awesome indicator is in the negative zone.
Scenario #2: I can sell Ethereum from the upper boundary of $2,340 if there is no market reaction to its breakout back towards the levels of $2,330 and $2,307.
Díky analytickým přehledům společnosti InstaForex získáte plné povědomi o tržních trendech! Jako zákazníkovi společnosti InstaForex je Vám k dispozici velký počet bezplatných služeb umožňujících efektivní obchodování.


