 Zůstat
Obchodní podmínky
Nástroje


The GBP/USD pair continued its downward movement on Friday, proving twice as strong as the EUR/USD pair. The British pound was dealt an additional blow by the political crisis in the UK and the likely slowdown in British inflation in April. In our view, the latter factor is significantly more important than the former. In recent months, the market has become convinced that the Bank of England's easing of monetary policy in the summer is a near certainty. However, this week it could be reported that inflation decreases to around 3%, which would make a rate cut impractical. Thus, expectations regarding the Bank of England are becoming more dovish, while those for the Federal Reserve are turning hawkish, and the geopolitical backdrop continues to disappoint and distress. The combination of these factors has led to a more significant decline in the pound than in the euro. The downward trend persists, and the market continues to wait for news from the Middle East.
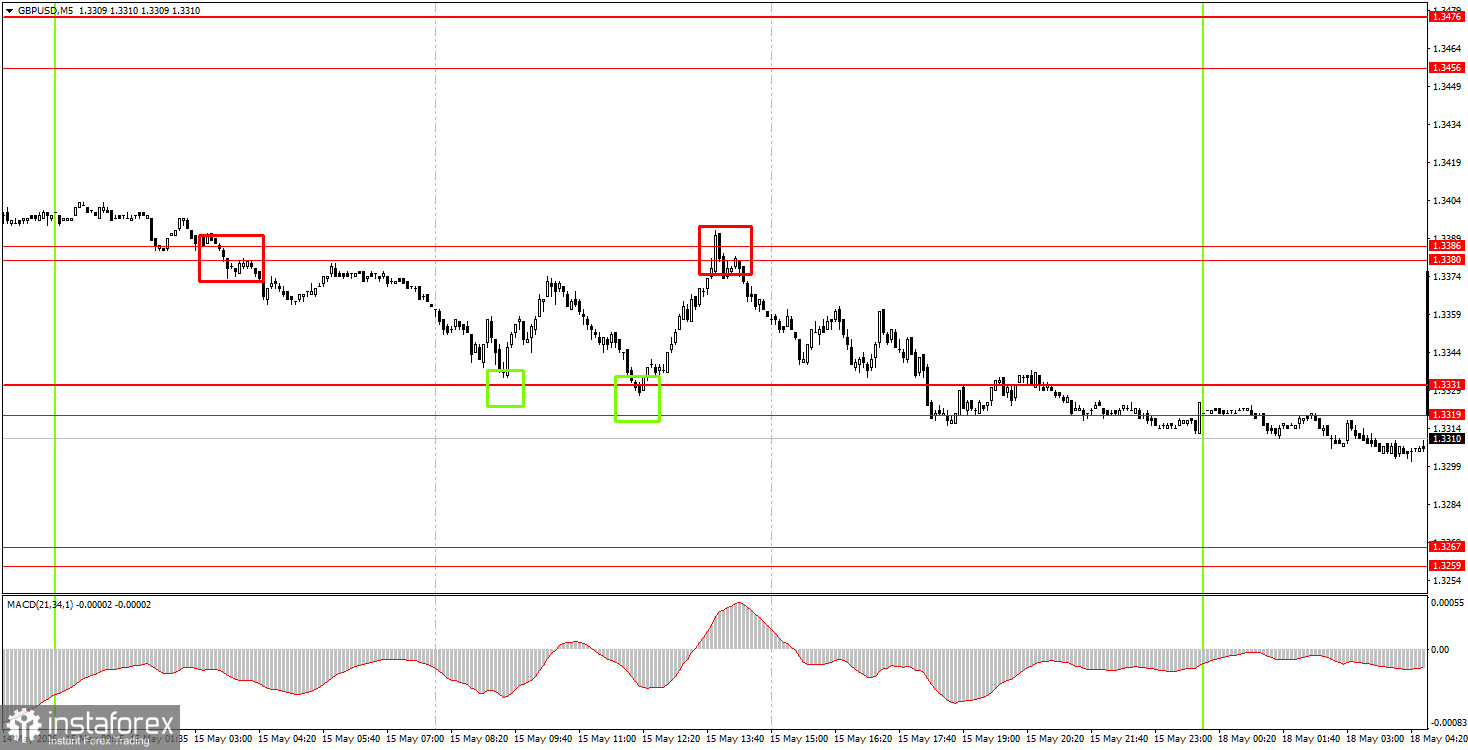
On the 5-minute timeframe, four trading signals were generated on Friday, each yielding a profit despite the low volatility. Initially, the pair broke through the 1.3380-1.3386 area, allowing short positions to be opened. Then it bounced twice off the area of 1.3319-1.3331, enabling long positions. Afterward, it bounced off the 1.3380-1.3386 area. In three out of four cases, the nearest target area was achieved.
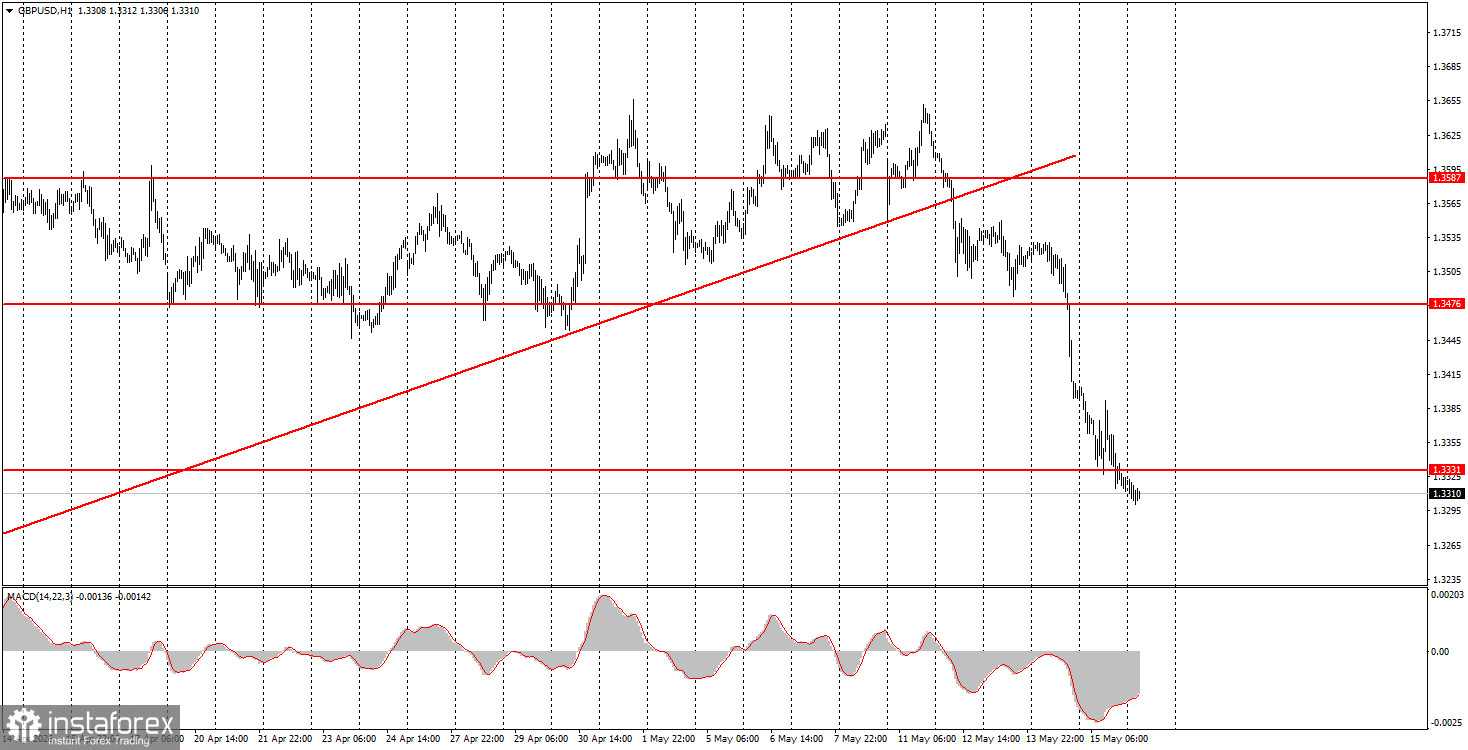
On the hourly timeframe, the GBP/USD pair has indeed begun a downward trend due to geopolitical pressure. Without a serious escalation in the Middle East, the dollar cannot expect to appreciate as it did in February and March. However, certain events can still provoke its strengthening, which we are observing in recent days.
On Monday, novice traders may open short positions targeting 1.3259-1.3267, as the pair has consolidated below the 1.3319-1.3331 range. A consolidation above the 1.3319-1.3331 area will allow opening long positions with a target of 1.3380-1.3386.
On the 5-minute timeframe, traders can currently consider the following levels: 1.3175-1.3180, 1.3259-1.3267, 1.3319-1.3331, 1.3380-1.3386, 1.3456-1.3476, 1.3587-1.3598, 1.3631-1.3641, 1.3695, 1.3741-1.3751. Today, no significant events are scheduled in the UK or the US, so there will be nothing for traders to react to. No geopolitical news has emerged over the weekend, except for new demands from Trump to Iran to reach an agreement as soon as possible—on American terms.
Price levels (areas) of support and resistance – levels that are targets when opening purchases or sales, or sources of signals.
Red lines – channels or trend lines that display the current trend and indicate which direction is preferable to trade now.
MACD indicator (14, 22, 3) – histogram and signal line – a supporting indicator that can also be used as a source of signals.
Important speeches and reports (contained in the news calendar) can significantly influence the movement of the currency pair. Therefore, during their release, trading should be done as cautiously as possible, or one should exit the market to avoid a sharp price reversal against the preceding movement.
Beginners trading in the Forex market should remember that not every trade can be profitable. Developing a clear strategy and sound money management are key to long-term trading success.
Díky analytickým přehledům společnosti InstaForex získáte plné povědomi o tržních trendech! Jako zákazníkovi společnosti InstaForex je Vám k dispozici velký počet bezplatných služeb umožňujících efektivní obchodování.


