 Zůstat
Obchodní podmínky
Nástroje


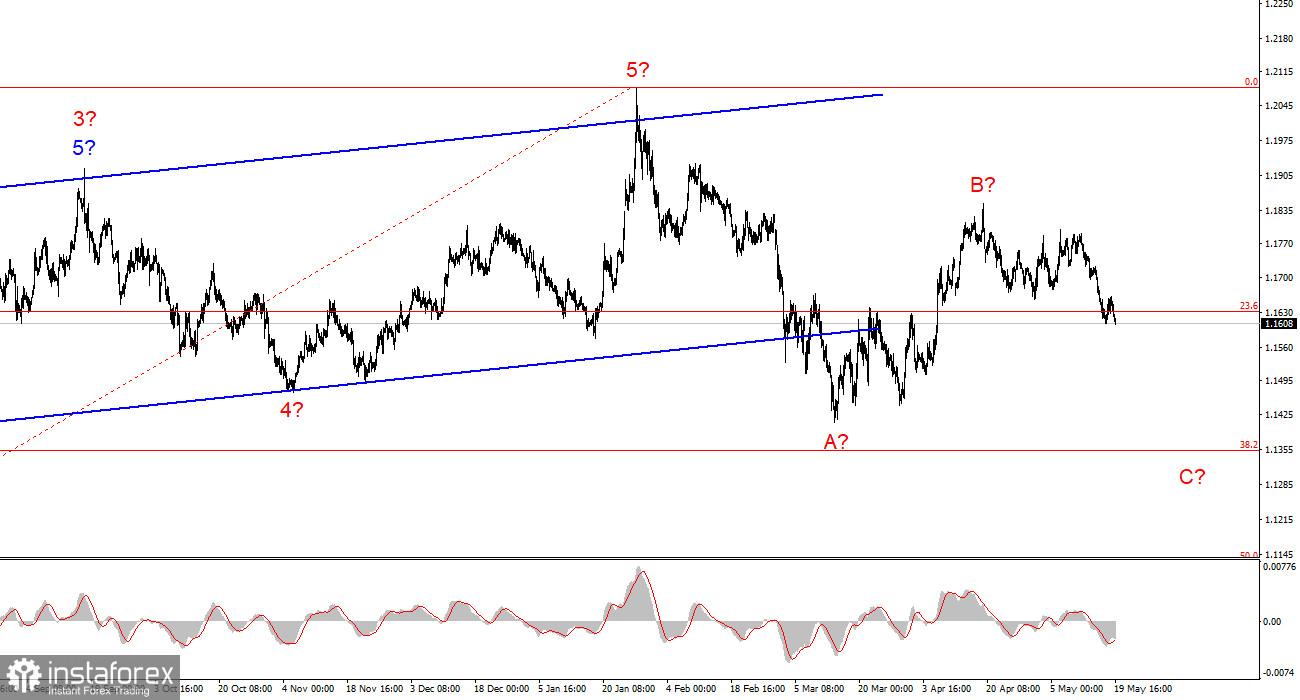
The wave pattern on the 4-hour EUR/USD chart has changed. There is still no talk of canceling the upward trend segment (shown in the lower chart), which began in January last year; however, the wave structure of the trend has now taken on a corrective form. In the long term, a wave C may develop, whose low should be below the low of wave A. At present, such a strong decline in the euro is difficult to believe, but the first quarter of 2026 showed that geopolitics can work wonders and reverse trends.
On the lower timeframe, I can identify a classic three-wave upward corrective structure. After this structure was completed, a new downward trend segment began to form, which, logically, should be impulsive. If this assumption is correct, we are likely to see the development of a five-wave structure within wave C of a higher degree, with targets below the 1.1400 level. Is there informational justification for such a strong strengthening of the dollar? In my view, not at the moment. Monday showed that Tehran and Washington may return to the negotiating table, which would make further dollar strengthening unlikely.
The EUR/USD pair resumed its decline on Tuesday and had lost about 50 basis points by the start of the U.S. session. As we can see, the euro's rise on Monday was nothing more than a coincidence. Although Iran and the U.S. may return to negotiations soon and neither side is currently inclined toward escalation, the market still does not believe in a near-term ceasefire or the reopening of the Strait of Hormuz. The presumed wave 3 or C continues to develop and may complete around the 1.1578 level, which corresponds to the 61.8% Fibonacci retracement.
The news background on Tuesday did not suggest trouble for the euro. Although Donald Trump once again issued threats toward Iran, he also confirmed that new strikes are postponed for at least several days and possibly indefinitely. Trump stated that the UAE and Saudi Arabia asked him not to resume aggression against Iran, as they see a possibility of a deal in the near future. It is unclear how accurate this information is, given that Saudi leaders only on Monday reported preparing a retaliatory strike against Iran for drone attacks on one of their nuclear power plants. I believe Trump does not want to restart the war and is therefore delaying escalation as much as possible.
In the UK, the unemployment report for March was released today. Unemployment came in higher than expected, which triggered further declines in both the pound and the euro. Based on all of the above, the current news background is insufficient to complete the downward wave structure. Considering that this structure may represent a higher-degree wave C, the decline could continue below the 1.1400 level.
Based on the EUR/USD analysis, I conclude that the instrument remains within a broader upward trend segment (lower chart), while in the shorter term it is in a corrective structure. The corrective a-b-c wave pattern appears to be completed. Therefore, wave 3 or C is currently developing, which may be part of a larger wave C. The full wave C (if the current wave count is correct) may complete much lower than the 1.1400 area. However, such a scenario would require strong geopolitical support. Otherwise, the downward wave structure may take the form of a-b-c and finish around 1.1578.
On the higher timeframe, an upward trend segment is visible, after which a corrective wave structure begins forming. In the near term, wave C is expected to develop with targets around 1.1352, which corresponds to the 38.2% Fibonacci level. After the completion of the A-B-C structure, a new long-term upward trend may begin.
Díky analytickým přehledům společnosti InstaForex získáte plné povědomi o tržních trendech! Jako zákazníkovi společnosti InstaForex je Vám k dispozici velký počet bezplatných služeb umožňujících efektivní obchodování.


