 Zůstat
Obchodní podmínky
Nástroje


The EUR/USD currency pair resumed its downward movement on Tuesday, dropping even lower than the previous week. Therefore, it is still too early to talk about a change in market sentiment to a bullish one. We continue to believe that the dollar will not achieve significant growth this time around. Despite the abundance of diverse geopolitical news, there are no real movements in either possible direction. Consider this: Has the war in the Middle East resumed? No. Have Iran and the U.S. signed a peace agreement? No. Perhaps there has been substantial progress in negotiations? No. Is the Strait of Hormuz open? No. Essentially, everything remains the same as it was a few weeks ago. Thus, there were not many reasons for the current strengthening of the U.S. dollar. However, the market clearly hoped for a swift achievement of a "nuclear agreement," and when it realized that such dreams were unfounded, it stopped buying risk assets and currencies. Therefore, for the second consecutive week, the dollar is moving smoothly upward.
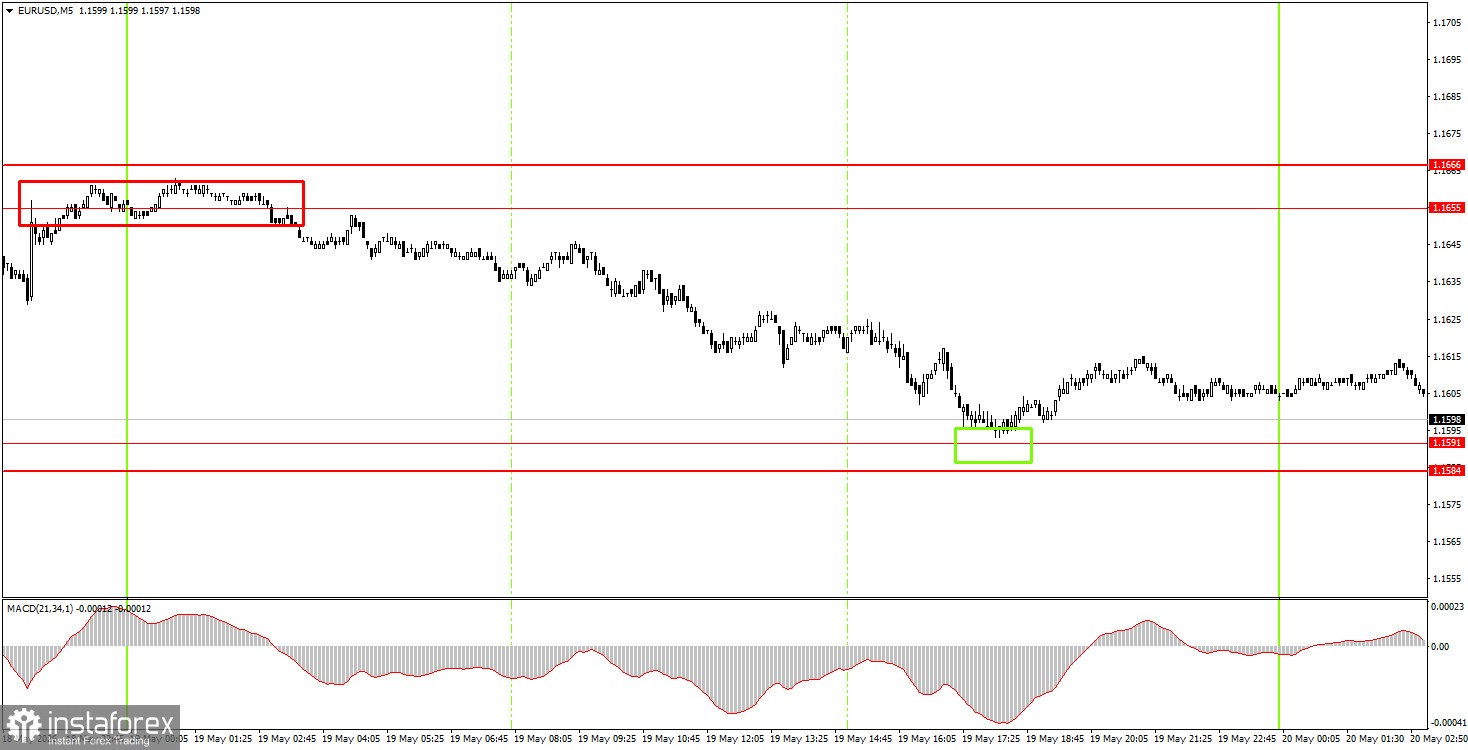
On the 5-minute timeframe on Tuesday, two trading signals were generated. A sell signal was generated overnight when the price bounced off the 1.1655-1.1666 range. However, by the time the European trading session opened, the price had retreated from the formation point, allowing novice traders to open short positions. As the evening approached, the pair reached the 1.1584-1.1591 area and formed a buy signal, which could also be executed and carried over to Wednesday.
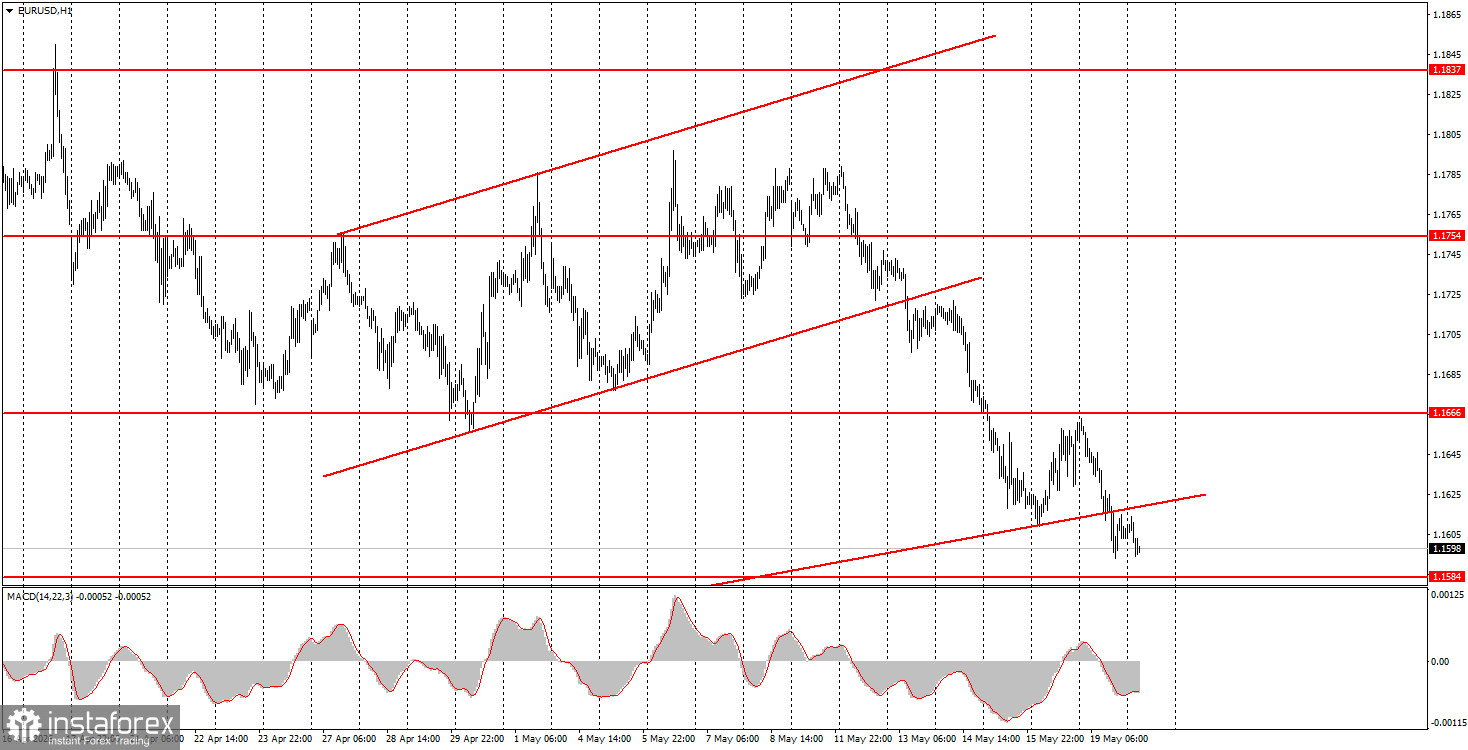
On the hourly timeframe, the euro has been correcting for an entire month. The U.S. dollar has resumed its rise amid heightened tensions in the Middle East last week, but we still do not expect sustained strength. The market continues to largely ignore fundamentals and macroeconomics.
On Wednesday, novice traders may open new short positions targeting 1.1527-1.1531 if the price breaks below the 1.1584-1.1591 area. Buy trades can be considered on a price bounce from the area of 1.1584-1.1591 with a target of 1.1655-1.1666.
On the 5-minute timeframe, the following levels should be considered: 1.1354-1.1363, 1.1413, 1.1455-1.1474, 1.1527-1.1531, 1.1584-1.1591, 1.1655-1.1666, 1.1745-1.1754, 1.1830-1.1837, 1.1899-1.1908. On Wednesday, the Eurozone will publish the second estimate of April inflation, while the U.S. will release the minutes from the last FOMC meeting, held three weeks ago. We consider both events to be of secondary importance.
Price levels (areas) of support and resistance – levels that are targets when opening purchases or sales, or sources of signals.
Red lines – channels or trend lines that display the current trend and indicate which direction is preferable to trade now.
MACD indicator (14, 22, 3) – histogram and signal line – a supporting indicator that can also be used as a source of signals.
Important speeches and reports (contained in the news calendar) can significantly influence the movement of the currency pair. Therefore, during their release, trading should be done as cautiously as possible, or one should exit the market to avoid a sharp price reversal against the preceding movement.
Beginners trading in the Forex market should remember that not every trade can be profitable. Developing a clear strategy and effective money management are key to long-term trading success.
Díky analytickým přehledům společnosti InstaForex získáte plné povědomi o tržních trendech! Jako zákazníkovi společnosti InstaForex je Vám k dispozici velký počet bezplatných služeb umožňujících efektivní obchodování.


