 Zůstat

Obchodní podmínky
Nástroje


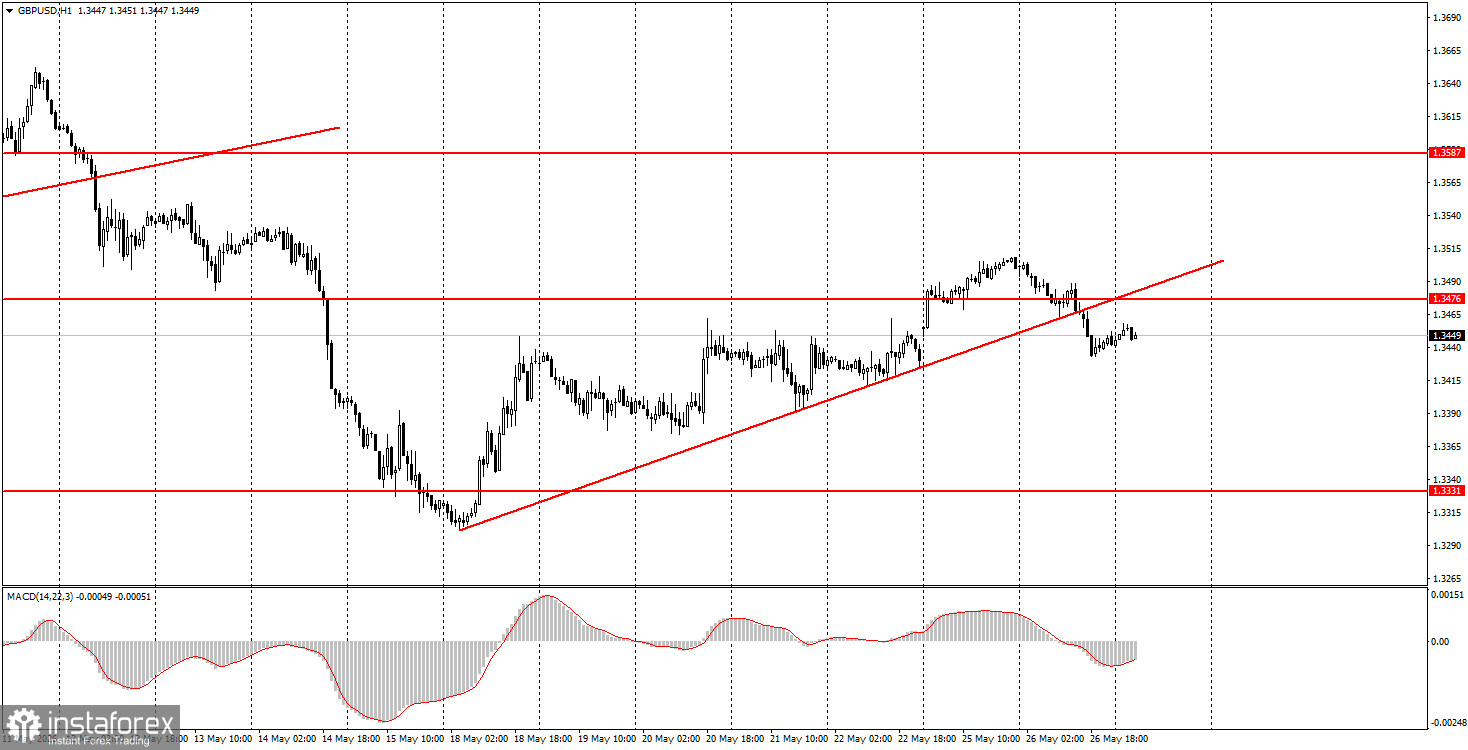
The GBP/USD pair also traded with low volatility on Tuesday, but in the afternoon, it showed a slight decline, which could have been driven by rising tensions in the Middle East. Recall that yesterday, U.S. armed forces struck Iranian boats and missile installations along the coast of the Strait of Hormuz. A few hours later, Iranian representatives stated that this escalation would not go unanswered and questioned the feasibility of further negotiations with Washington. Thus, the deal Donald Trump discussed all weekend, which could be signed "in the coming days," is once again under significant doubt. As a result of yesterday's drop, the GBP/USD pair fell below the ascending trend line, so a decline in the British currency may be observed until the end of the week. However, we must remind you once again that geopolitics is currently in control. If a memorandum of understanding is signed today, the GBP/USD pair could rise regardless of the technical picture.
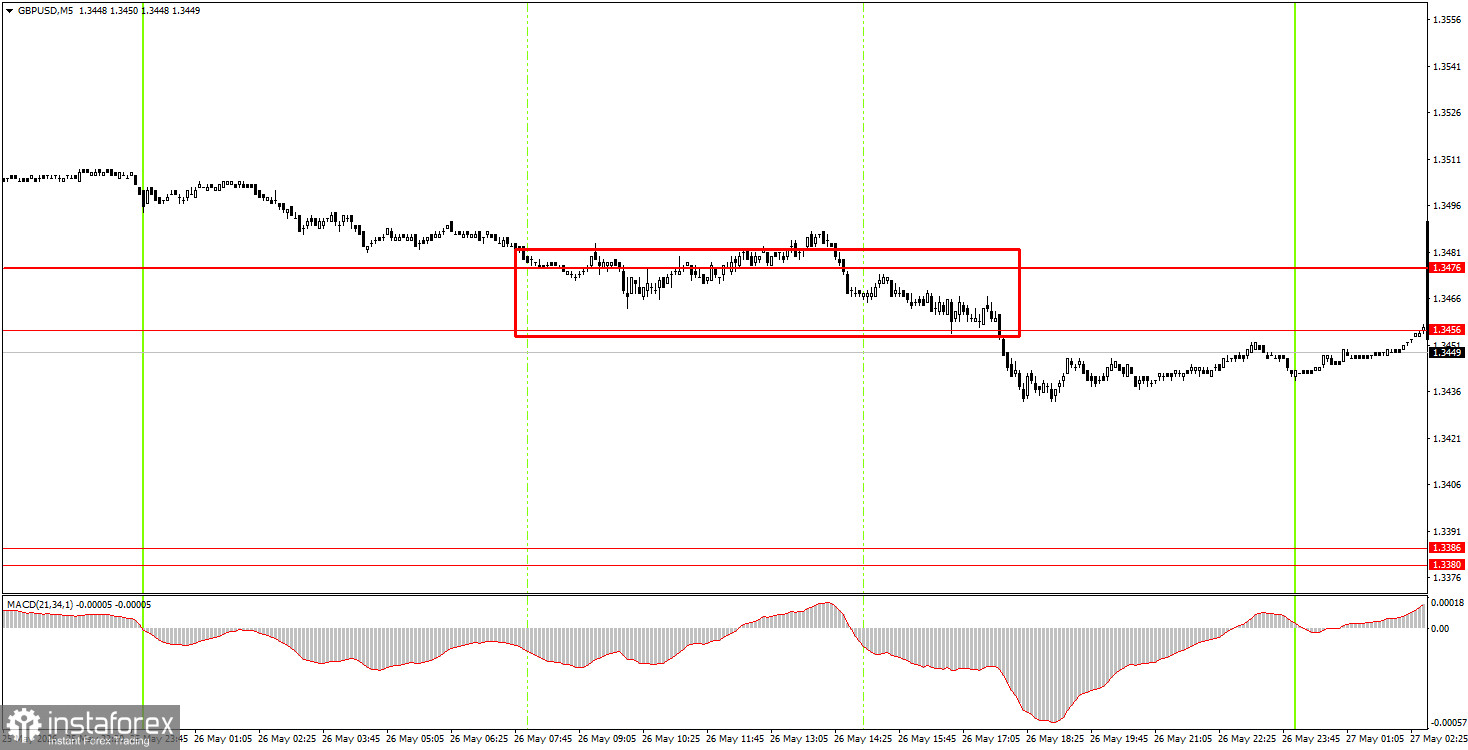
On the 5-minute timeframe, the pair generated one sell signal on Tuesday, which was closer to the evening. The price struggled to break through the 1.3456-1.3476 area, which allowed for opening short positions. We did not observe a significant decline in the pair on Tuesday, so it's reasonable to remain in shorts today.
On the hourly timeframe, the GBP/USD pair began to form an upward trend, only to finish quickly as geopolitical conditions worsened again. However, without a resumption of full-scale war in the Middle East, the dollar cannot be expected to rise as it did in February and March. Individual events may still provoke their strengthening (as seen on Tuesday), but we do not believe the market will start a new wave of risk aversion.
On Wednesday, novice traders may open short positions targeting 1.3380-1.3386 if the price bounces from the 1.3456-1.3476 area. A consolidation above the 1.3456-1.3476 area allows for opening long positions with targets of 1.3587-1.3598. It's important to keep in mind the low volatility at this time.
On the 5-minute timeframe, trading can currently occur at levels 1.3175-1.3180, 1.3259-1.3267, 1.3319-1.3331, 1.3380-1.3386, 1.3456-1.3476, 1.3587-1.3598, 1.3631-1.3641, 1.3695, and 1.3741-1.3751. Once again, there are no significant events or reports scheduled in the UK or the US today, so the market will focus on geopolitics and technical analysis.
Price levels (areas) of support and resistance – levels that are targets when opening purchases or sales, or sources of signals.
Red lines – channels or trend lines that display the current trend and indicate which direction is preferable to trade now.
MACD indicator (14, 22, 3) – histogram and signal line – a supporting indicator that can also be used as a source of signals.
Important speeches and reports (contained in the news calendar) can significantly influence the movement of the currency pair. Therefore, during their release, trading should be done as cautiously as possible, or one should exit the market to avoid a sharp price reversal against the preceding movement.
Beginners trading in the Forex market should remember that not every trade can be profitable. Developing a clear strategy and effective money management are key to long-term trading success.
Díky analytickým přehledům společnosti InstaForex získáte plné povědomi o tržních trendech! Jako zákazníkovi společnosti InstaForex je Vám k dispozici velký počet bezplatných služeb umožňujících efektivní obchodování.


