 Zůstat
Obchodní podmínky
Nástroje


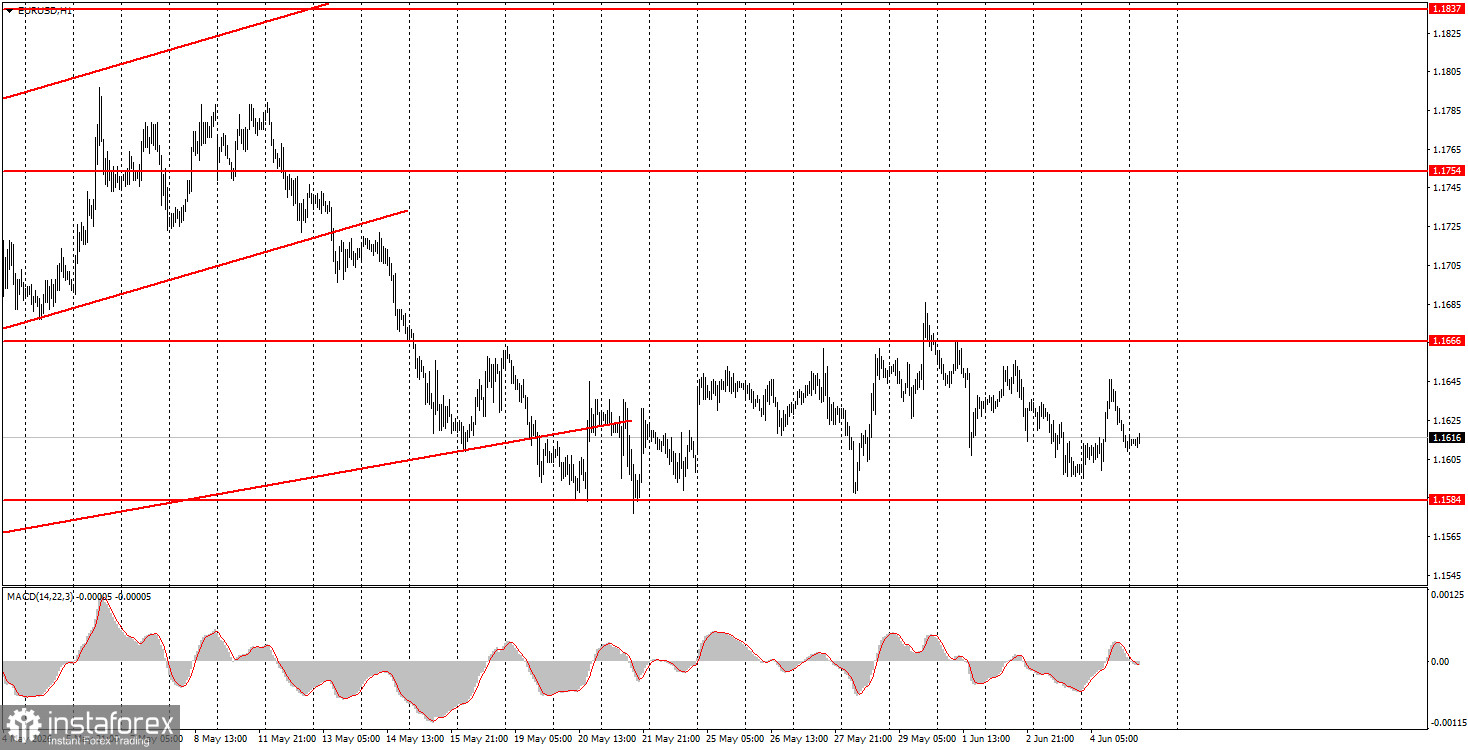
The EUR/USD currency pair continues to trade within a clearly visible sideways channel on the hourly timeframe. Traders still cannot find grounds to buy or sell the pair. The macroeconomic background is largely ignored, the fundamental background is insignificant, and in terms of geopolitics, the market is waiting for important news and events rather than more threats, ultimatums, and promises. This is why we have been observing the same picture for three weeks: events and news exist, but there is virtually no movement in the market. However, Thursday was an exception to this rule. Throughout the day, no news was available to traders. There were no geopolitical, fundamental (Christine Lagarde had nothing important to report), or macroeconomic updates (excluding secondary reports such as jobless claims or retail sales). Thus, there were no grounds to expect the end of the flat movement. Today, volatility may be higher than usual, but we are not confident in the flat's completion.
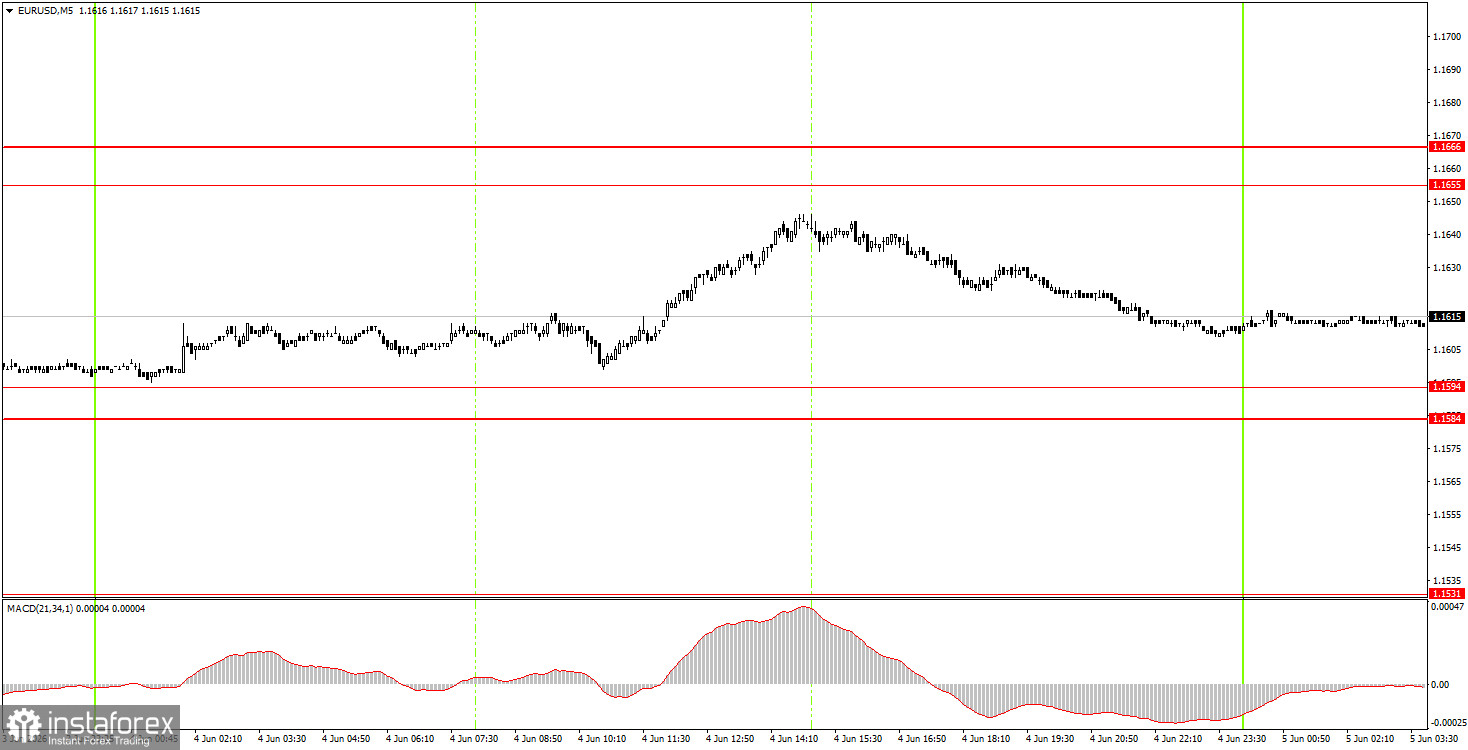
On the 5-minute timeframe on Thursday, no trading signals were formed. The last sell signals were generated on Tuesday, when the price bounced twice from the 1.1655-1.1666 area.
On the hourly timeframe, the euro has been correcting for a month and has been in a range for three weeks. The growth of the American currency has resumed, as the conflict in the Middle East is once again on the brink of escalation, but we still do not expect a long-term rise in the American currency. The market continues to largely ignore fundamentals and macroeconomics, while geopolitics is factored in selectively.
On Friday, novice traders can open short positions with targets of 1.1527-1.1531 if the price breaks through the 1.1584-1.1591 area. Long positions can be considered if the price bounces from the 1.1584-1.1591 area, with a target of 1.1655-1.1666.
On the 5-minute timeframe, levels to consider are 1.1354-1.1363, 1.1413, 1.1455-1.1474, 1.1527-1.1531, 1.1584-1.1591, 1.1655-1.1666, 1.1745-1.1754, 1.1830-1.1837, 1.1899-1.1908. On Friday, the Eurozone will publish the third estimate of first-quarter GDP, while in the US, Non-Farm Payrolls and the unemployment rate will be released. American reports are considered important and may trigger volatility, but this does not mean the euro's flat will end today. The market has been ignoring even important reports in recent months.
Price levels (areas) of support and resistance are targets when opening long or short positions or sources of signals.
Red lines indicate channels or trend lines that display the current trend and indicate the preferred direction for trading.
The MACD indicator (14,22,3) – histogram and signal line – is a supplementary indicator that can also be used as a source of signals.
Important speeches and reports (contained in the news calendar) can significantly impact the movement of the currency pair. Therefore, during their release, trading should be conducted with maximum caution, or one should exit the market to avoid sharp reversals against preceding movements.
Beginners trading in the forex market should remember that not every trade can be profitable. Developing a clear strategy and practicing money management are keys to success in trading over the long term.
Díky analytickým přehledům společnosti InstaForex získáte plné povědomi o tržních trendech! Jako zákazníkovi společnosti InstaForex je Vám k dispozici velký počet bezplatných služeb umožňujících efektivní obchodování.


