 Zůstat
Obchodní podmínky
Nástroje



In recent days, Bitcoin recovered by about $4,000; however, this movement can hardly be classified as a correction. Overall, Bitcoin has lost $22,000 from its last local peak and $65,000 from its all-time high (ATH). On the daily timeframe, there have been no bullish patterns or other signs of an end to the decline. Following the $22,000 drop, we see no current desire in the market to buy "digital gold" at "bargain prices." Therefore, the last few days may simply be a pause before a new collapse. Currently, Bitcoin has dropped to its most recent local low on the daily chart, but there has been no clear liquidity sweep to suggest a possible bullish takeover. Recall that a liquidity sweep involves "eating" Stop Losses and pending orders by market makers. Simply put, it is a manipulative movement aimed at gathering the necessary liquidity for movement in the opposite direction. When this occurs, the price tends to reverse sharply. Currently, we do not observe anything of the sort.
Yesterday evening, the cryptocurrency market gained a little momentum, albeit briefly and not significantly. Donald Trump announced that new strikes on Iran were canceled because the parties are close to reaching an agreement. This statement came on the same day he announced planned strikes on Iran for Friday and accused Tehran of dragging out negotiations. Whether to believe the American leader this time is up to you. Nevertheless, many experts immediately noted a "sharp rise" in Bitcoin, which is barely discernible even on the 4-hour timeframe. We believe that yesterday's minor strengthening of the first cryptocurrency has little to do with geopolitics, or at least it is not the main reason. Bitcoin has reached a point where a small correction is overdue. The last correction was extremely slow and lasted three months. Thus, we may be awaiting a new, protracted period of weak growth in Bitcoin before another collapse.
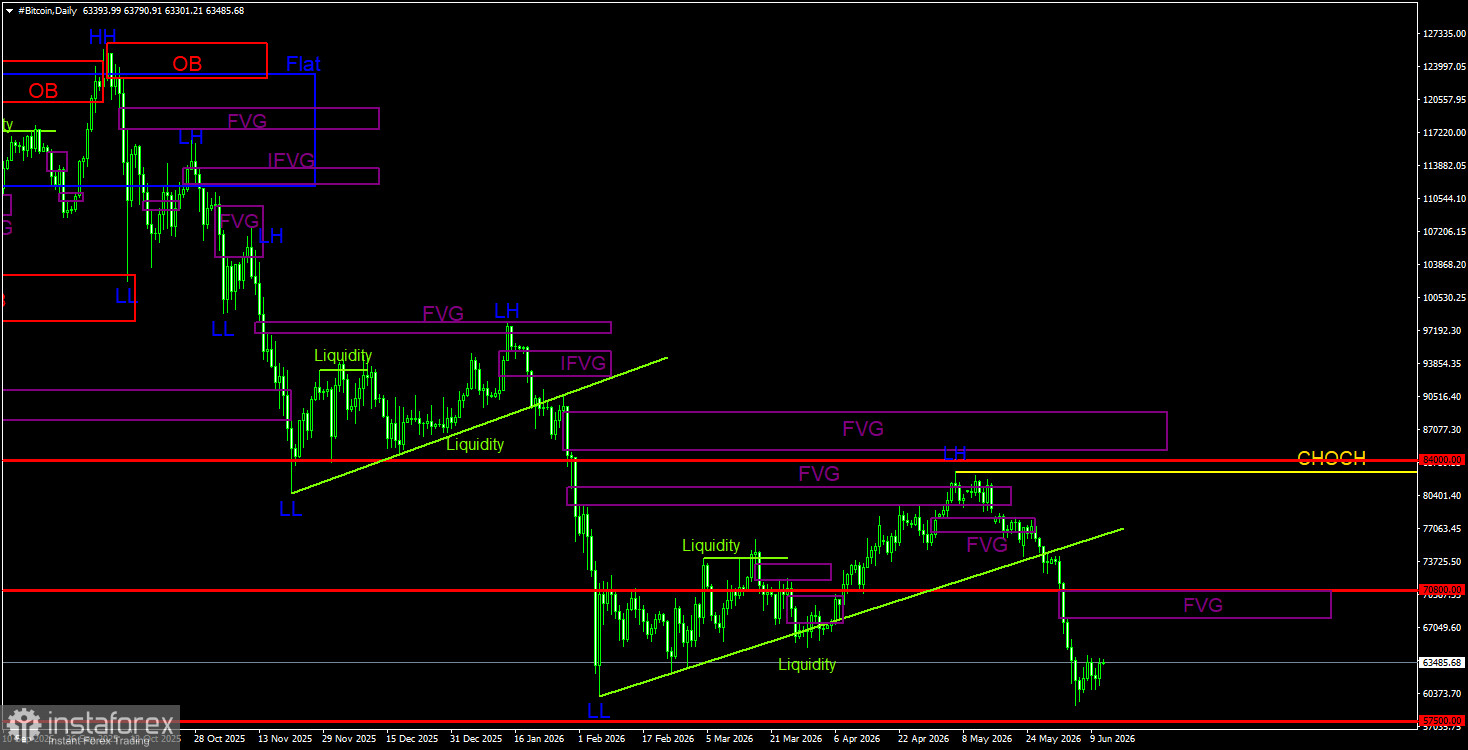
On the daily timeframe, Bitcoin has resumed forming a downward trend. The trend structure is identified as descending, and the CHOCH line has been moved to $82,800, with a new Lower Low (LL) formed. Only above this level can the downward trend be considered completed. Since there are still no signs of an upward trend reversal, we expect the decline to continue. On the daily timeframe, a new bearish FVG has formed in the $68,000 - $70,700 range. Other FVG can be identified during the current Bitcoin decline, but this one is the most obvious. Thus, new sell signals may be formed within this pattern in the future.
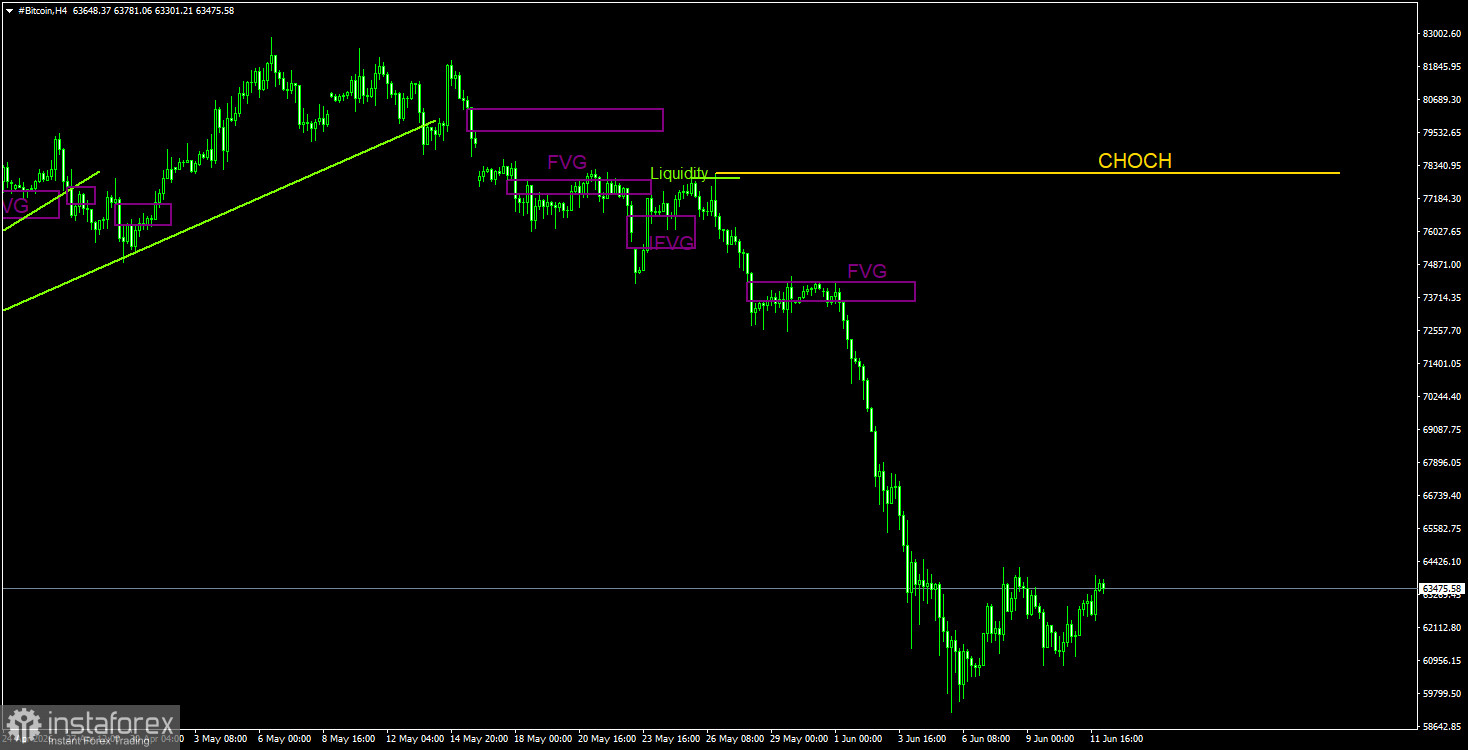
On the 4-hour timeframe, Bitcoin has begun to show signs of a correction. The CHOCH line, which supports the downward trend, is at $78,000, but it may need to be moved lower soon. This requires at least a minimal correction. Bearish patterns can be used to open new short positions, but the current decline is so strong that it is better to focus on the daily timeframe for these strategies. As for buying deals, these are also possible from bullish patterns on the 4-hour timeframe, but one should understand that strong growth in a downward trend is unlikely. The best-case scenario involves short-term, small-volume long positions.
Bitcoin continues to form a full downward trend and a correction against it. We continue to expect a drop toward $57,500 (the 61.8% level on the Fibonacci retracement from the three-year upward trend), and there are still no signs of the beginning of an upward trend. The last bearish FVG was formed in the area of $68,000 - $70,700; therefore, this area serves as a POI for short positions in the coming weeks. On the 4-hour timeframe, the cryptocurrency may correct in the near future, so if traders wish to trade against the trend, they can consider long positions from bullish patterns.
Díky analytickým přehledům společnosti InstaForex získáte plné povědomi o tržních trendech! Jako zákazníkovi společnosti InstaForex je Vám k dispozici velký počet bezplatných služeb umožňujících efektivní obchodování.


