 Zůstat
Obchodní podmínky
Nástroje


Bitcoin has been trading below the average aggregate cost of mining for five consecutive months — that level now sits at $78,000. This means miners on average are selling Bitcoin for less than it costs them to produce it, and roughly 20% of industry participants are operating at a direct loss, forced to sell coins into the market to cover operating expenses.

The result is predictable: less efficient miners shut down operations, the hash rate falls, and mining difficulty declines accordingly. Last week, difficulty plunged 10% — the second-largest drop since January this year. For the market, this is a two-edged signal: on one hand, forced miner sell-offs create constant downward pressure on price. On the other hand, miner capitulation has historically preceded the end of bear cycles.
JPMorgan believes the current weakness could act as a contrarian buy signal for Bitcoin. The logic is classic cycle theory: when miners capitulate and leave the market, bitcoin supply from that source falls sharply. The remaining players — more efficient and lower-cost — continue operating but sell less. A 10% weekly drop in difficulty means weak players are already exiting — so one of the main sources of forced supply is starting to dry up. This aligns with other signals we've noted earlier: long-term holder transfers to exchanges have fallen to their lowest level since 2015, and the share of supply trading at a loss has reached 50% — another historical sign of capitulation.
The aggregate picture is mixed — but that is precisely what a cycle bottom looks like in real time, not in hindsight.
Trading recommendations
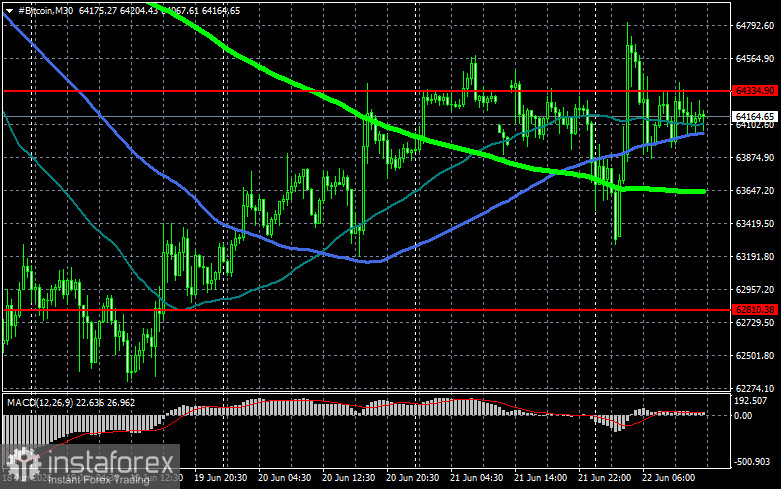
Bitcoin
Buyers are currently targeting a return to $64,300, which would open a direct path to $66,000 and put $67,700 within reach; a break above that level would signal attempts to restore a bull market. On the downside, buyers are expected around $62,800. A move back below that area could quickly push BTC toward $61,200. The furthest downside target is $59,600.
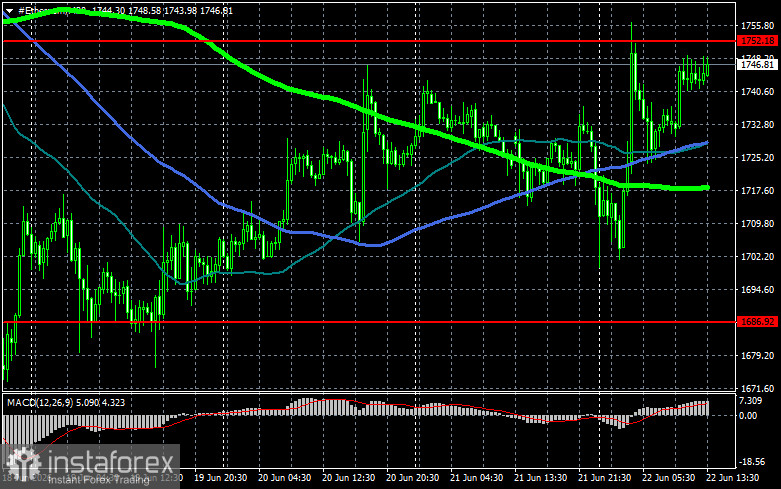
Ethereum
A clear hold above $1,752 would open a direct path to $1,838. The more distant target is the high near $1,901; a break above that would indicate strengthening bullish sentiment and a return of buyer interest. On the downside, buyers are expected at $1,686. A move back below that level could quickly push ETH toward $1,615. The furthest downside target is $1,557.
What's on the chart
Price testing or crossing any of these moving averages often either halts movement or injects fresh momentum into the market.
Díky analytickým přehledům společnosti InstaForex získáte plné povědomi o tržních trendech! Jako zákazníkovi společnosti InstaForex je Vám k dispozici velký počet bezplatných služeb umožňujících efektivní obchodování.


