 Zůstat

Obchodní podmínky
Nástroje


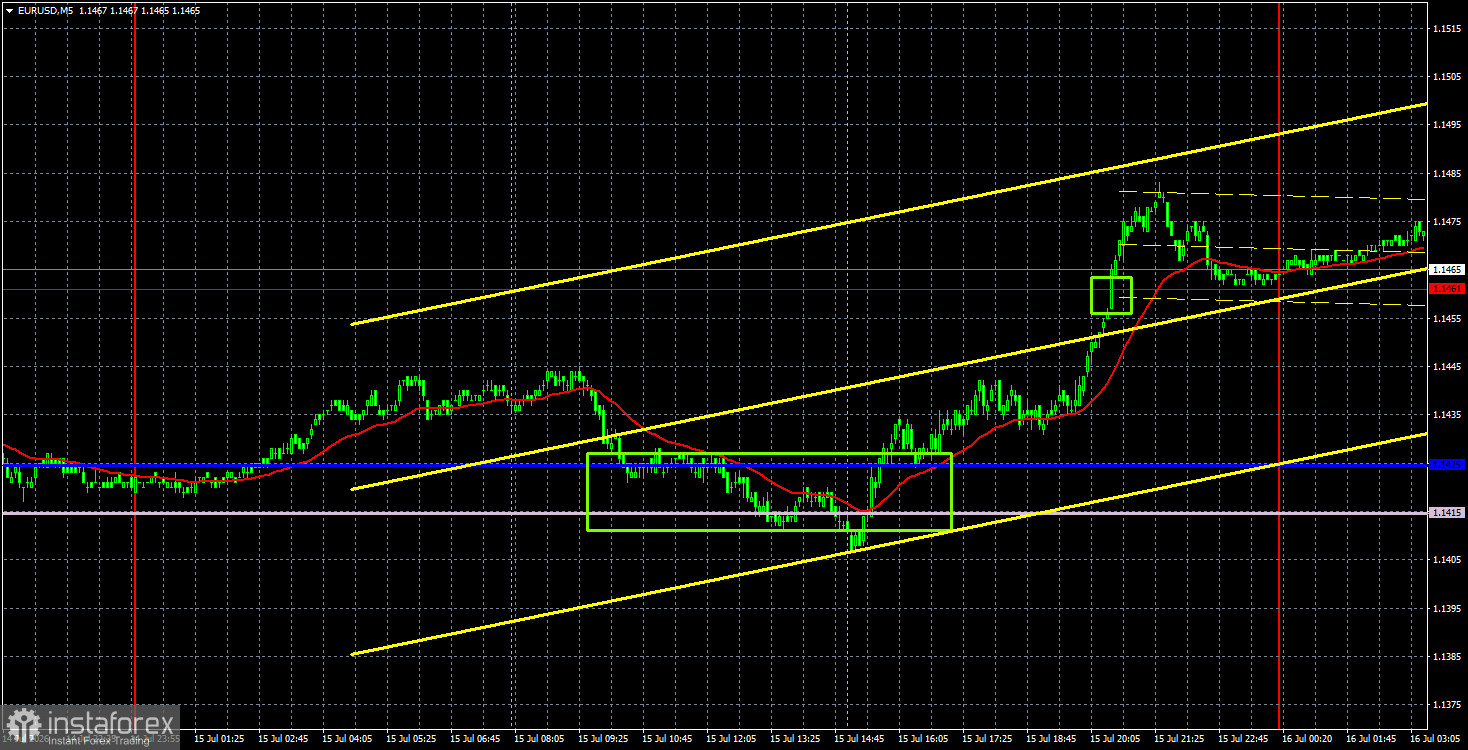
The EUR/USD currency pair showed quite a decent increase on Wednesday, but much of it again occurred within the sideways channel. Recall that this week at least two reports were released that should have significantly reduced market interest in the dollar. First, U.S. inflation was published, coming in significantly lower than expected, followed by the producer price index, which also showed a fairly low value. Weak readings from both inflation indicators suggest the Federal Reserve may be inclined to tighten monetary policy, but whether it is needed remains a big question. If inflation is falling, the central bank has no need to raise rates here and now. Thus, at least until September, the Fed is likely to extend its pause. Going forward, everything will again depend on inflation, which is directly influenced by geopolitical events in the Middle East. Kevin Warsh's speech in the U.S. Congress did not provide any new information to traders.
From a technical perspective, the pair consolidated above the level of 1.1461, which we referred to as the upper boundary of the sideways channel. Thus, the three-week flat may have come to an end. We fully support the euro's growth, as we believe the market has no further reason to buy dollars at full throttle. The global uptrend remains intact, and the Fed's monetary policy tightening has not yet been predetermined.
On the 5-minute timeframe on Wednesday, one buy signal was formed. For about 6 hours, the pair formed a rebound from the area of the Senkou Span B and Kijun-sen lines. After the formation, it showed upward movement of 45 pips, simultaneously overcoming the level of 1.1461. Today, the upward movement may continue.
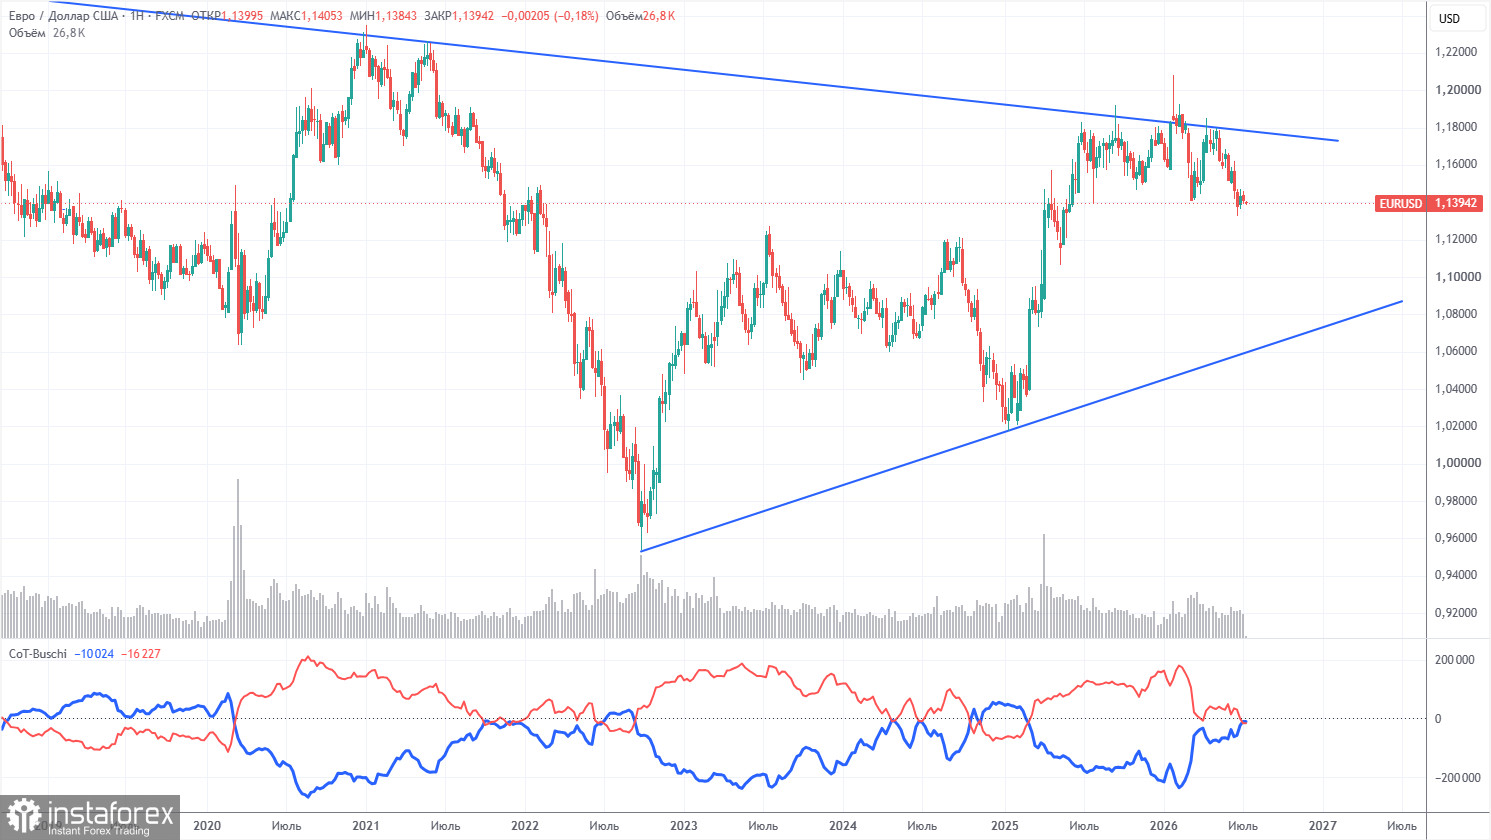
The latest COT report is dated July 7. The net position of non-commercial traders remains "bullish" but has declined significantly due to geopolitical events. Traders have been shedding the euro in favor of the U.S. dollar in recent months. Donald Trump's policies have not changed, but for some time the dollar acted as a "reserve currency." However, this process may have already been completed.
We still do not see any fundamental factors that would strengthen the euro, but there are plenty of factors that could cause the American dollar to decline. The war in the Middle East made the dollar temporarily super-attractive, but when this factor expires, everything will return to normal. And it may have already expired. In the long term, the euro could fall to the level of $1.08 (trend line), but the upward trend will still remain relevant. Moreover, during the recent months of dollar growth, the pair did not get significantly closer to this line.
The positioning of the red and blue lines of the indicator indicates parity between bulls and bears. During the last reporting week, the number of longs for the "Non-commercial" group decreased by 12,200, while the number of shorts increased by 5,100. Accordingly, the net position fell by 17,300 contracts over the week.
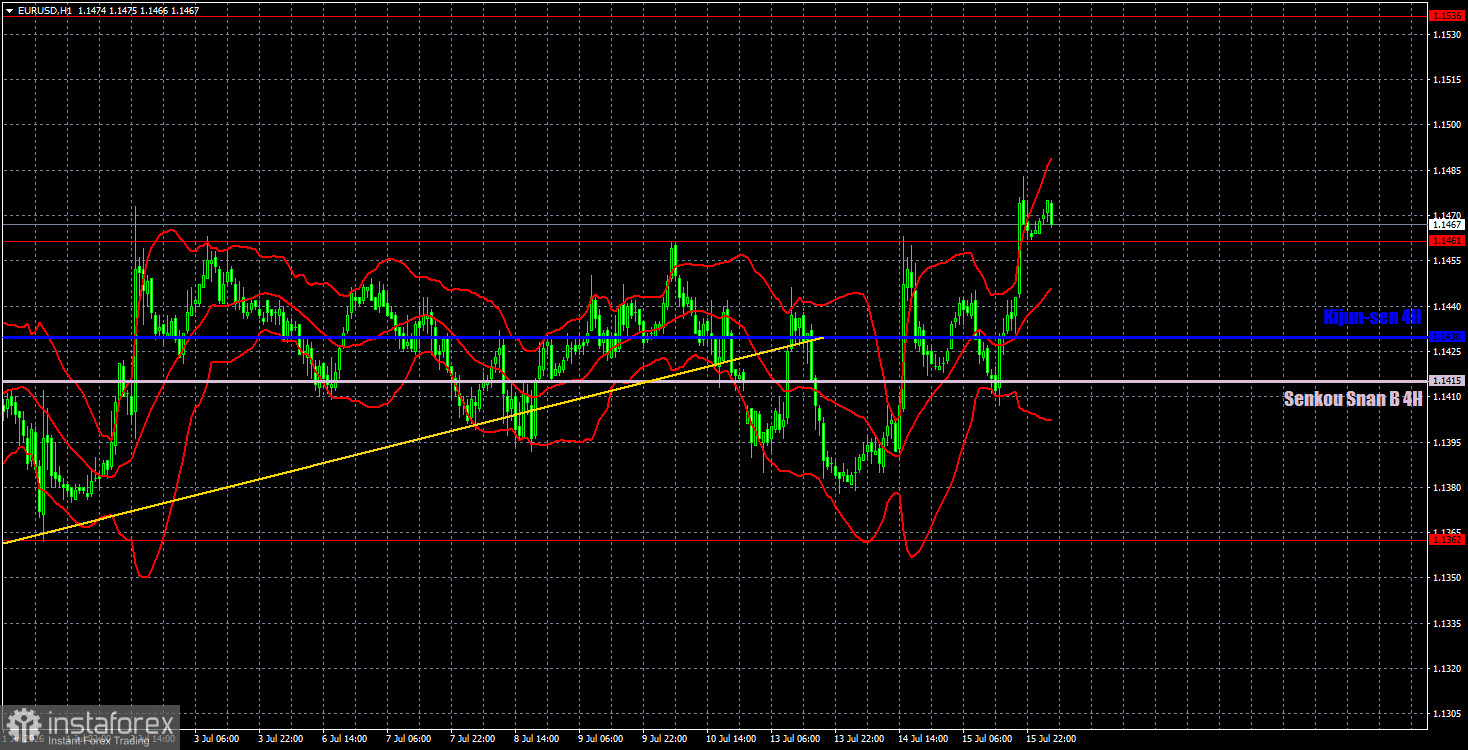
On the hourly timeframe, a corrective upward trend continues to form within a two-month downtrend, and the flat is presumably over. The situation in the Middle East remains tense and is not improving. The market continues to ignore many factors in favor of the euro, but the euro is getting back on its feet as the market reassesses the American dollar.
For July 16, we highlight the following levels for trading—1.1234, 1.1274, 1.1362, 1.1461, 1.1536-1.1542, 1.1585, 1.1657-1.1666, 1.1750-1.1760, 1.1786, 1.1830-1.1837, as well as the Senkou Span B line (1.1415) and Kijun-sen line (1.1430). The Ichimoku indicator lines may move during the day, which should be taken into account when determining trading signals. Do not forget to set a Stop Loss order to break even if the price moves in the correct direction by 15 pips. This will protect against potential losses if the signal proves false.
On Thursday, retail sales reports and unemployment claims will be published in the U.S., while the event calendar in the European Union is empty. We do not consider the scheduled reports to be significant, so technical factors will prevail today. If the flat is over, the euro should continue its upward movement.
Today, traders may consider short positions with targets at 1.1415 and 1.1362 if the price consolidates below 1.1461. Long positions can remain open with a target at 1.1536-1.1542, as the pair consolidated above the level of 1.1461 yesterday, which serves as the upper boundary of the sideways channel. The pair's volatility remains low.
Price levels of support and resistance (resistance/support) – thick red lines around which movement may end. They are not sources of trading signals.
The Kijun-sen and Senkou Span B lines – lines of the Ichimoku indicator, transferred to the hourly timeframe from the 4-hour one. They are strong lines.
Extreme levels – thin red lines from which the price previously bounced. They are sources of trading signals.
Yellow lines – trend lines, trend channels, and any other technical patterns.
Indicator 1 on COT charts – the size of the net position for each category of traders.
Díky analytickým přehledům společnosti InstaForex získáte plné povědomi o tržních trendech! Jako zákazníkovi společnosti InstaForex je Vám k dispozici velký počet bezplatných služeb umožňujících efektivní obchodování.


