 Zůstat

Obchodní podmínky
Nástroje


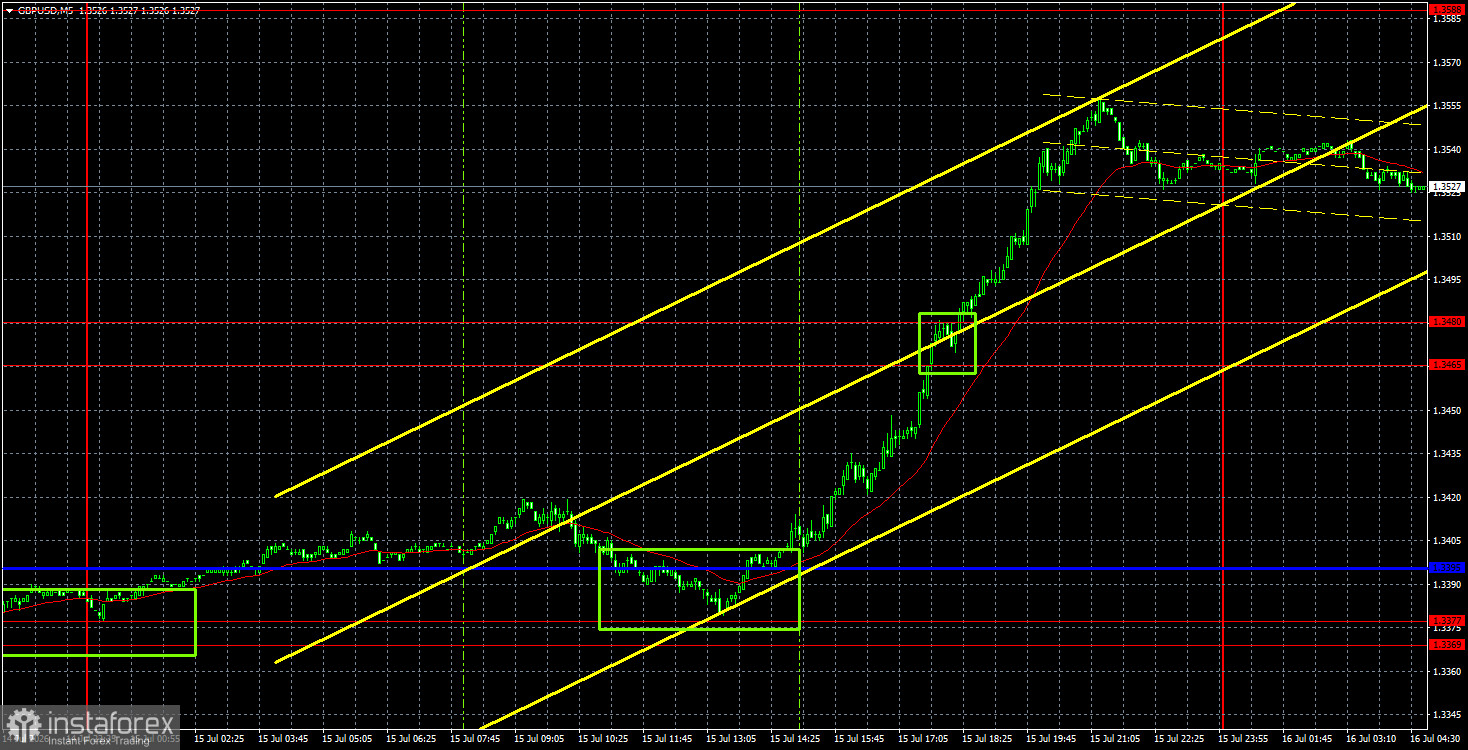
The GBP/USD currency pair showed an increase of 150 pips on Wednesday. The British currency has been rising for three consecutive weeks, and we consider this development entirely justified. Recall that we have repeatedly pointed out the illogicality of the last wave of U.S. dollar strengthening. In addition, we noted that the GBP/USD pair was at the lower end of the yearly sideways channel on the daily and weekly timeframes. Thus, the current upward movement is a restoration of fair value and a technical move after testing the lower boundary of the flat. The dollar has exhausted all available growth factors in 2026. In the final stages of the downtrend, the market paid no attention to fundamentals or macroeconomic data and simply bought dollars. We warned that this could be a manipulation by market makers aiming to push the pound down as far as possible to then buy at better prices before a strong rise. As a result, we have been observing the strengthening of the British currency for three weeks now. If there were all the grounds for this on Tuesday, then the growth observed yesterday cannot be explained by local events and reports. The pound clearly did not rise by 150 pips because of the producer price index.
From a technical perspective, the British pound continues its upward trend. We expected at least a small correction, but the pair failed to consolidate below the Senkou Span B line, so we did not see a correction.
On the 5-minute timeframe on Wednesday, two trading signals were formed. During the European trading session, the price bounced from the 1.3369-1.3395 area, allowing traders to open long positions. During the American session, the pound overcame the range of 1.3465-1.3480 and by the end of the day had risen a total of 120 pips from the point of signal formation.
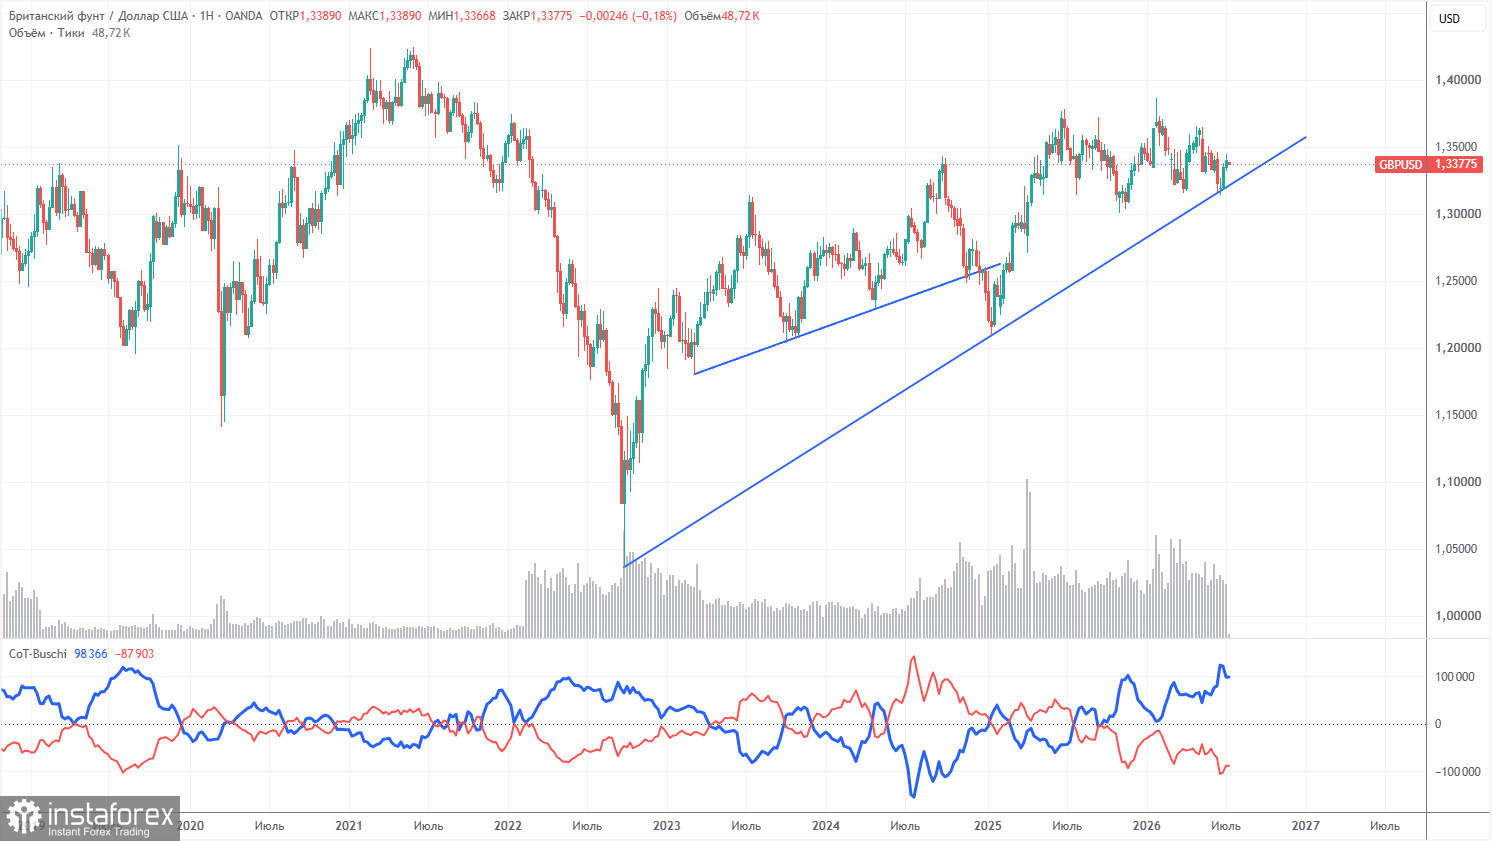
COT reports for the British pound show that non-commercial traders have dominated the market with sales for several months. The net position is negative, despite the long-term uptrend remaining intact. Given the events in the Middle East, it is not surprising that demand for risk currencies remains weak. The war is formally over, but conflict persists. Geopolitics may support demand for the U.S. dollar in the near future. However, until we see a consolidation below the trend line, we would not expect a significant decline in the pair.
In the long term, the dollar will continue to weaken due to Donald Trump's policies, as clearly seen on the weekly timeframe (illustration above). The trade war will continue in one form or another for a long time, and Trump's policies are aimed directly and indirectly at weakening the U.S. currency. The long-term uptrend remains intact, as evidenced by the trend line. Recently, the price tested this line and bounced off it. According to the latest COT report (dated July 7), the "Non-commercial" group opened 7,400 BUY contracts and closed 6,800 SELL contracts. Thus, the net position of non-commercial traders increased by 14,200 contracts over the week, which does not significantly influence the overall sentiment of professional players.
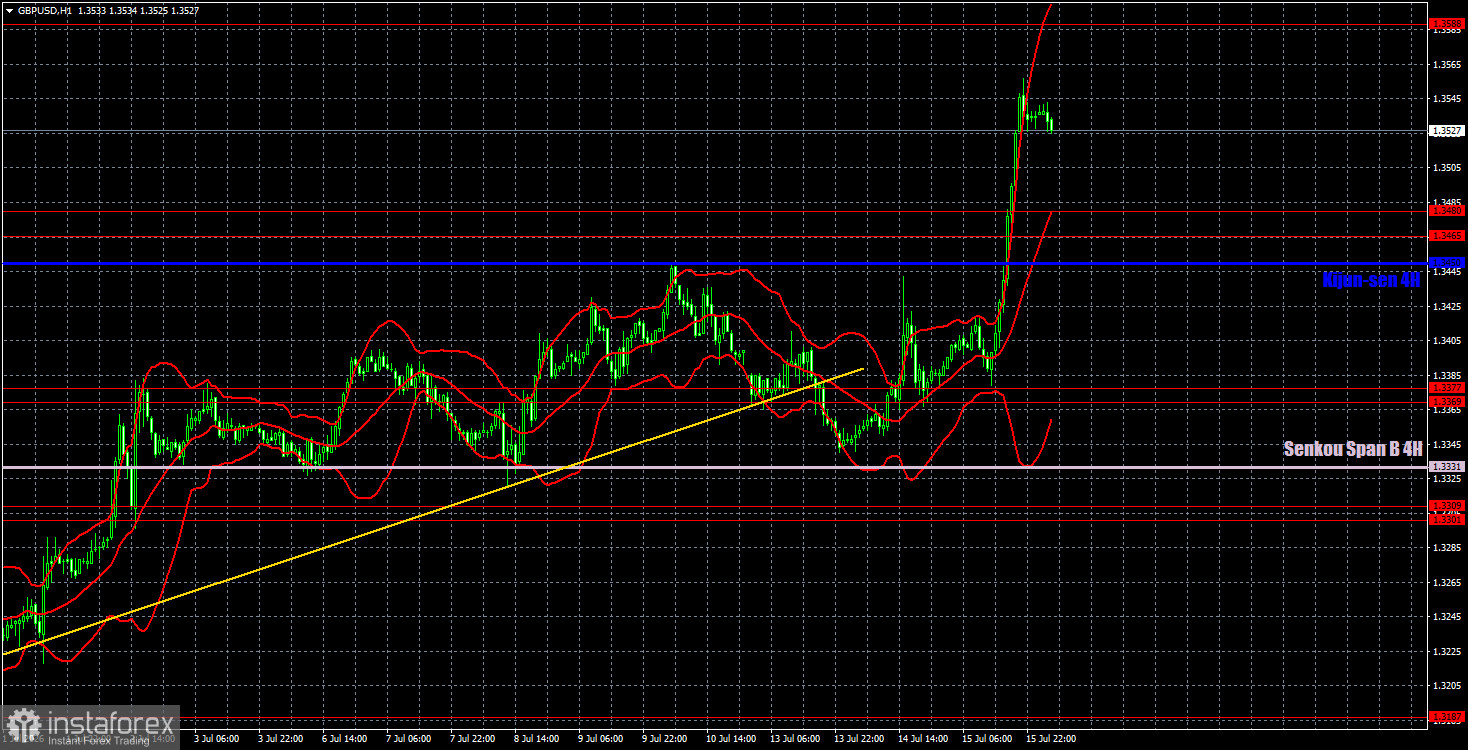
On the hourly timeframe, the GBP/USD pair may begin a correction as the rise has lasted for three weeks. However, there are currently no technical or other grounds for a correction. The market continues to ignore geopolitics, and in the last three weeks, we have witnessed a technical rise. We would not be surprised if the British currency continues to strengthen, as on the daily timeframe it is heading toward the upper boundary of the sideways channel, which is in the range of 1.3720-1.3800.
For July 16, we highlight the following important levels: 1.3042-1.3050, 1.3096-1.3115, 1.3179-1.3187, 1.3301-1.3309, 1.3369-1.3377, 1.3465-1.3480, 1.3588, 1.3671-1.3681. The Senkou Span B line (1.3331) and the Kijun-sen line (1.3450) can also serve as signal sources. A stop-loss level is recommended to break even when the price moves 20 pips in the correct direction. The Ichimoku indicator lines may move during the day, which should be taken into account when determining trading signals.
On Thursday, GDP and industrial production data for May are scheduled to be released in the U.K. In the U.S., retail sales and unemployment claims will be published. All four reports can be considered secondary, and they may provoke only a slight reaction from traders that clearly will not affect the overall picture.
Today, traders may open short positions with targets in the range of 1.3465-1.3480 if the pair bounces from 1.3588. New long positions can be opened in the event of a bounce from the area of 1.3465-1.3480 with a target of 1.3588.
Price levels of support and resistance (resistance/support) – thick red lines around which movement may end. They are not sources of trading signals.
The Kijun-sen and Senkou Span B lines – lines of the Ichimoku indicator, transferred to the hourly timeframe from the 4-hour one. They are strong lines.
Extreme levels – thin red lines from which the price previously bounced. They are sources of trading signals.
Yellow lines – trend lines, trend channels, and any other technical patterns.
Indicator 1 on COT charts – the size of the net position for each category of traders.
Díky analytickým přehledům společnosti InstaForex získáte plné povědomi o tržních trendech! Jako zákazníkovi společnosti InstaForex je Vám k dispozici velký počet bezplatných služeb umožňujících efektivní obchodování.


