 Zůstat

Obchodní podmínky
Nástroje


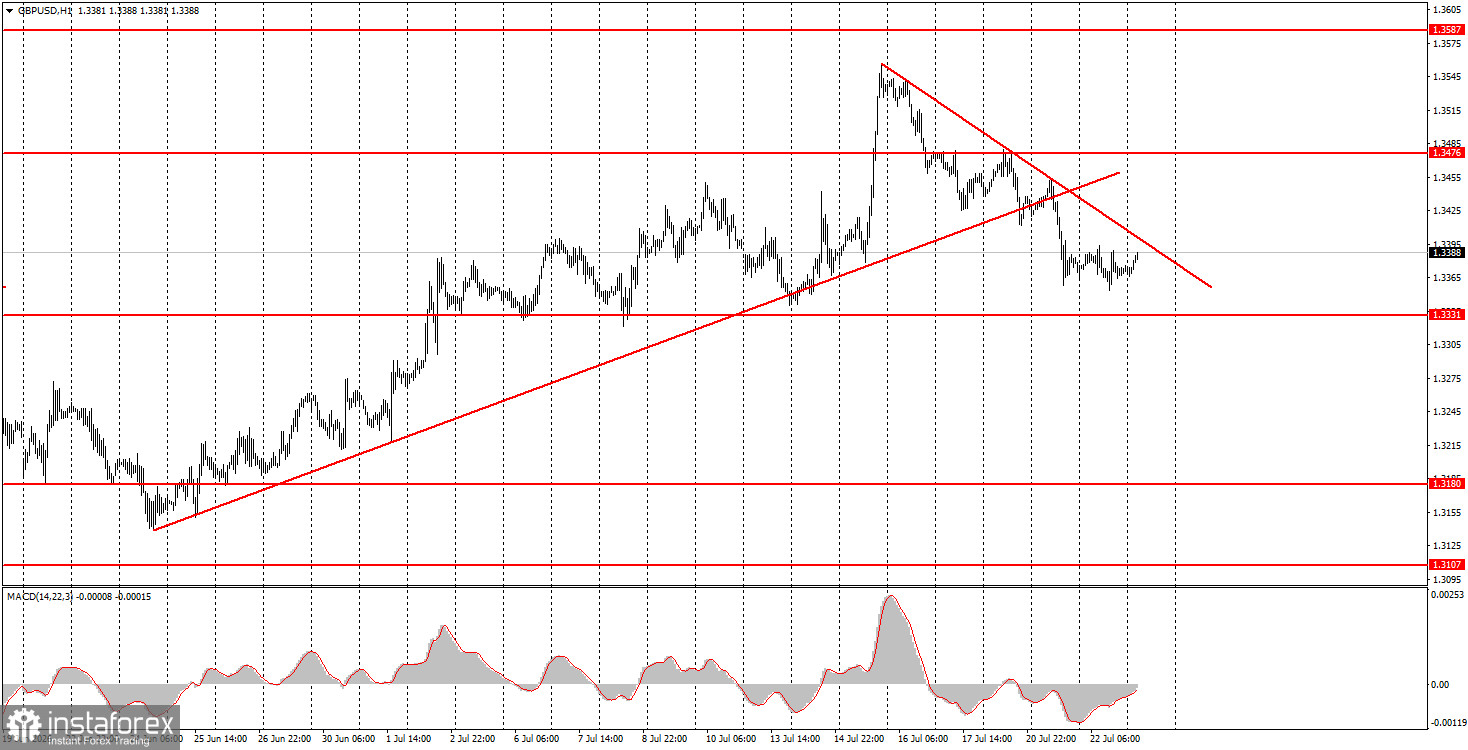
The GBP/USD pair continued its downward trend on Wednesday, which is taking the form of a full-fledged trend. The ascending trend line has been broken, and a new descending trend line has been established. Thus, the British pound may continue its decline in the near term due to technical factors. Yesterday, the most important report of the week—on inflation for June—was published in the UK. However, on that very day, market movements were virtually absent. The market either priced in the decline in UK inflation in advance or continues to trade by its own rules, which have nothing to do with fundamental and macroeconomic analysis. In any case, the downward trend is relevant; the pound sterling, unlike the euro, is not standing still, so we can still expect good movements. We believe that after the completion of the current downward correction, the British pound will target the area of 1.3700-1.3800, which represents the upper boundary of the sideways channel on the weekly timeframe.
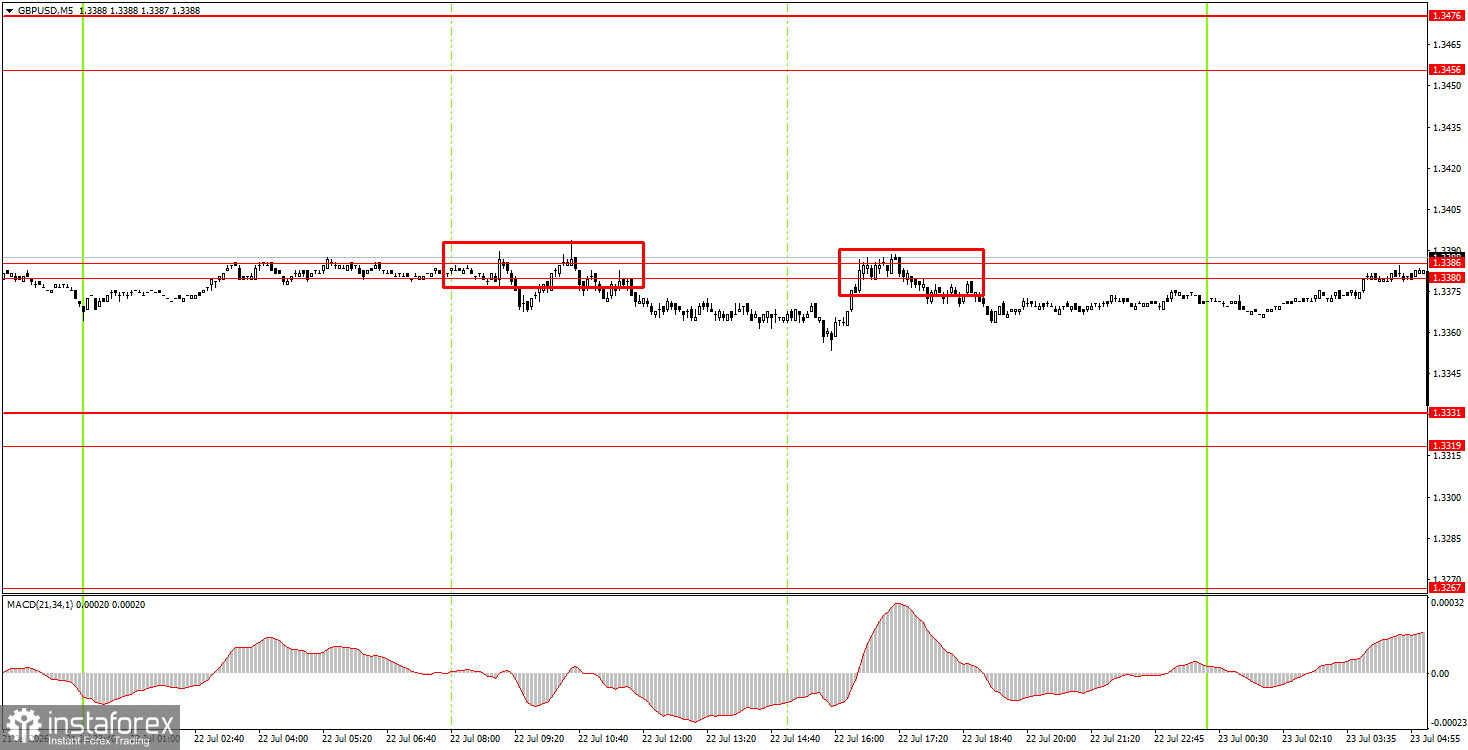
On the 5-minute timeframe on Wednesday, two sell signals were generated. The price bounced off the area of 1.3380-1.3386 twice but was unable to move down even 20 pips on either occasion. The overall volatility of the day was an "unreal" 40 pips.
On the hourly timeframe, the GBP/USD pair has begun a new downward trend. After three weeks of growth, a correction was necessary. It is difficult to say how long the British pound will fall, but traders currently have a good reference point in the form of the trend line. Thus, until the price establishes itself above this line, the downward trend remains.
On Thursday, novice traders may open short positions if the price bounces from the area of 1.3380-1.3386, targeting 1.3319-1.3331. A consolidation above the area of 1.3380-1.3386 will allow for the opening of long positions targeting 1.3456-1.3476.
On the 5-minute timeframe, the following levels can currently be traded: 1.3096-1.3107, 1.3175-1.3180, 1.3259-1.3267, 1.3319-1.3331, 1.3380-1.3386, 1.3456-1.3476, 1.3587-1.3598, 1.3631-1.3641, 1.3695. On Thursday, there are no significant events scheduled in the UK or the US, but ironically, it is on this day that the pair may show decent movements. Yesterday's inflation report for the UK was simply ignored by the market. Today, the macroeconomic background will be absent, but the British pound has not been stagnant in recent weeks, unlike the euro.
Price levels (areas) of support and resistance are targets when opening long or short positions or sources of signals.
Red lines indicate channels or trend lines that display the current trend and indicate the preferred direction for trading.
The MACD indicator (14,22,3) – histogram and signal line – is a supplementary indicator that can also be used as a source of signals.
Important speeches and reports (contained in the news calendar) can significantly impact the movement of the currency pair. Therefore, during their release, trading should be conducted with maximum caution, or one should exit the market to avoid sharp reversals against preceding movements.
Beginners trading in the forex market should remember that not every trade can be profitable. Developing a clear strategy and practicing money management are key to long-term success in trading.
Díky analytickým přehledům společnosti InstaForex získáte plné povědomi o tržních trendech! Jako zákazníkovi společnosti InstaForex je Vám k dispozici velký počet bezplatných služeb umožňujících efektivní obchodování.


