 Zůstat

Obchodní podmínky
Nástroje


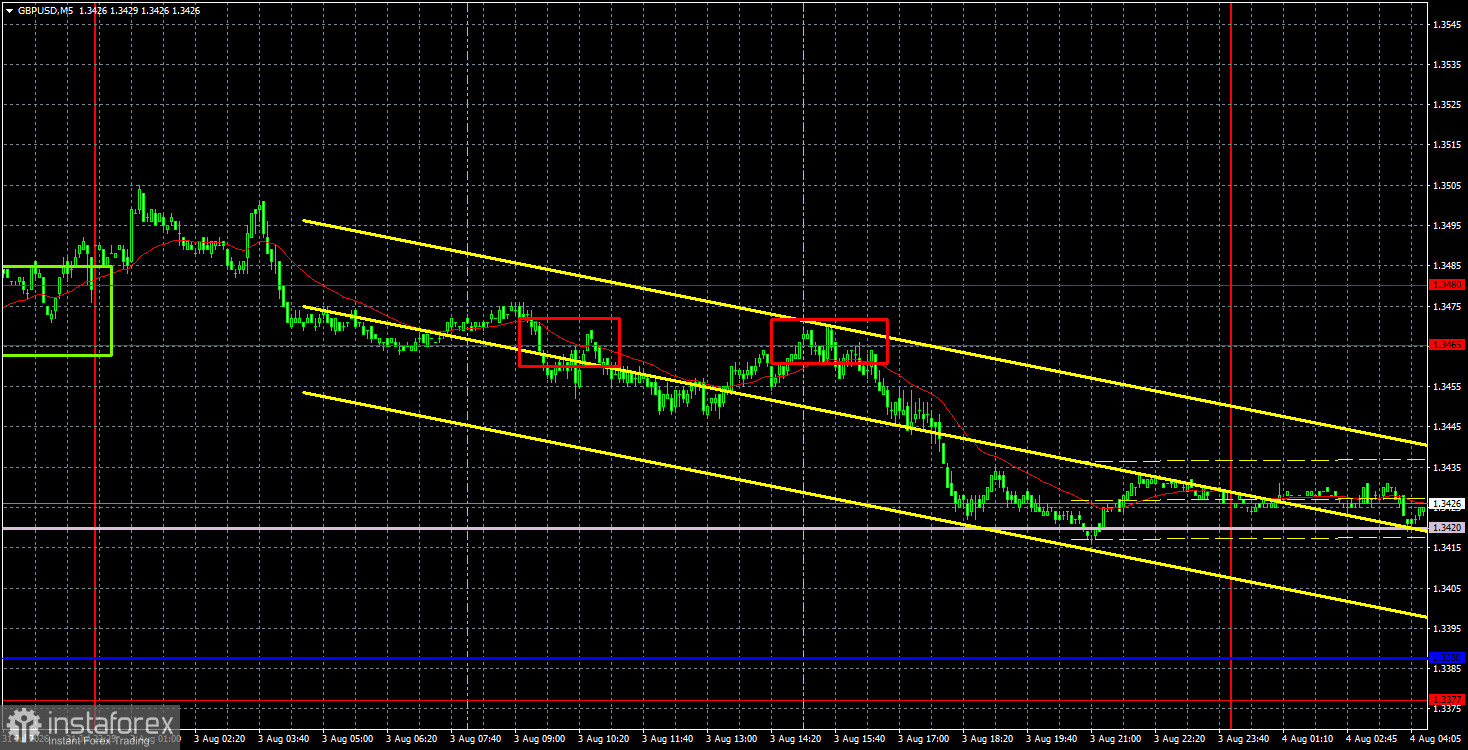
The GBP/USD currency pair also experienced a slight decline on Monday, which is fairly easy to explain. First, the pair showed significant growth last week, so a correction was needed. Second, the price failed twice to break through the 1.3465-1.3480 area. Third, the most important report on Monday—the ISM Manufacturing Index in the U.S.—showed a higher-than-anticipated July reading, which supported the dollar. Thus, the GBP/USD pair experienced a slight correction, but a fully justified upward trend has already begun that could develop further. This week, numerous important reports will be published in the U.S. For instance, we can highlight the second ISM index—this time in the services sector—along with the NonFarm Payrolls report and the unemployment rate. The geopolitical situation in the Middle East remains unclear. No matter how long the "Middle Eastern Santa Barbara" lasts, it will come to an end sooner or later, either through a new war or the signing of a peace agreement. Unfortunately, the chances of the former option are much higher. Tehran is in no hurry to sit at the negotiating table, aware of the process's futility. Donald Trump cannot abandon his geopolitical ambitions, which is why the parties cannot find common ground. However, for the U.S. dollar, this is no longer a factor likely to drive explosive growth.
Technically, the British pound continues to form an upward trend. It is worth noting that, in the long term, the pair is in a range, as is clear on the weekly timeframe. After reaching the lower boundary of the sideways channel, a logical movement towards the upper boundary has begun, which is not yet complete.
In the 5-minute timeframe, two sell signals formed on Monday that could have yielded traders a decent profit. The price twice bounced off the 1.3465-1.3480 area, prompting a drop to the Senkou Span B line. Around this line in the evening, traders could secure profits of about 30 pips.
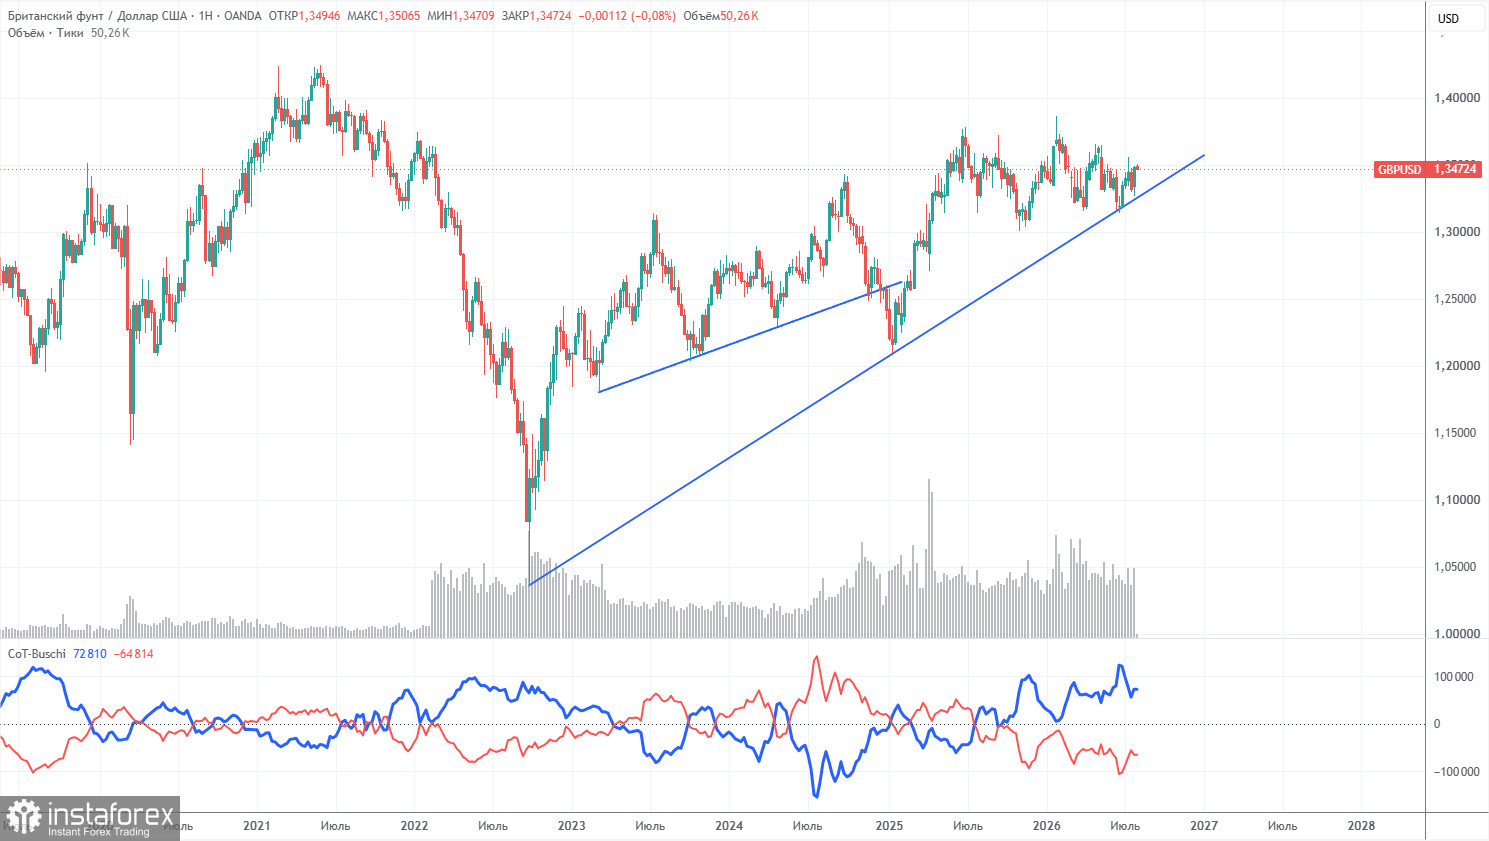
COT reports for the British pound show that non-commercial traders have dominated the market for several months with short positions. The net position is negative despite the long-term upward trend. Given the events in the Middle East, it is no surprise that demand for risk currencies remains weak. The war is formally over, but the conflict continues. Geopolitics may keep demand for the U.S. dollar strong in the near future. However, until there is a consolidation below the trend line, we wouldn't count on a significant drop in the pair.
In the long term, the dollar will continue to decline due to Donald Trump's policy, as can be clearly seen on the weekly timeframe (illustration above). The trade war will continue in one form or another for a long time, and Trump's policies are aimed directly and indirectly at weakening the American currency. The long-term upward trend remains in place, as evidenced by the trend line. The price recently tested this line and bounced off of it. According to the latest COT report (from July 28), the "Non-commercial" group closed 2,800 BUY contracts and opened 6,400 SELL contracts. Thus, the net position of non-commercial traders decreased by another 9,200 contracts over the week.
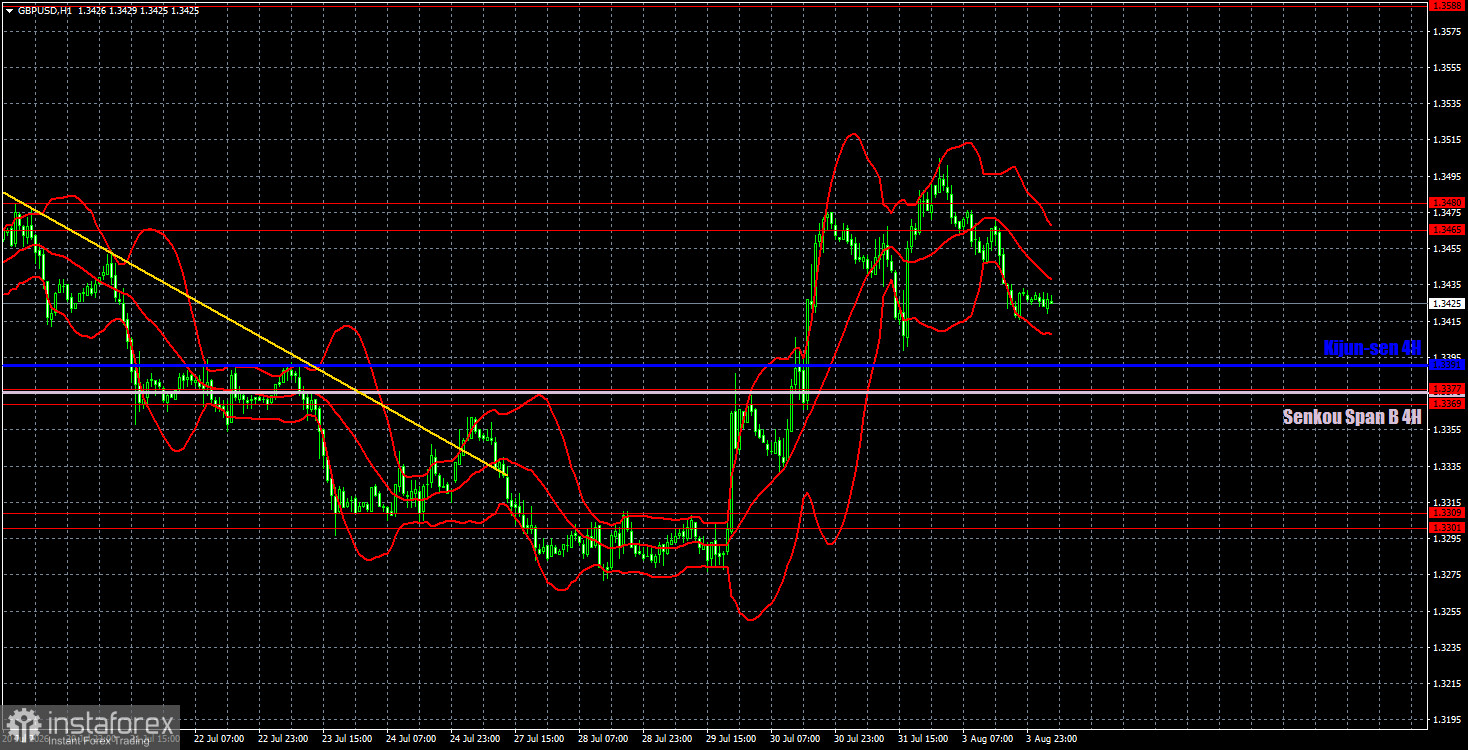
On the hourly timeframe, the GBP/USD pair has initiated an upward trend, thanks to the Bank of England and the Federal Reserve. In the long term, both European currencies still look set to move higher and have been trading within sideways channels for a whole year. This does not negate the upward trend that began back in 2022. We expect the British pound to continue to strengthen in the coming weeks, regardless of geopolitical and economic developments. This week, only data from the U.S. labor market could hinder the pound's growth.
For August 4, we highlight the following important levels: 1.3042-1.3050, 1.3096-1.3115, 1.3179-1.3187, 1.3301-1.3309, 1.3369-1.3377, 1.3465-1.3480, 1.3588, 1.3671-1.3681. The Senkou Span B line (1.3376) and Kijun-sen line (1.3391) may also serve as signal sources. It's advisable to set a Stop Loss at breakeven once the price has moved in the correct direction by 20 pips. The Ichimoku indicator lines may move throughout the day, which should be taken into account when determining trading signals.
On Tuesday, the UK economic calendar is empty, while the U.S. will release one of the less important labor market reports—JOLTs. Typically, the market either ignores this report or reacts with a restrained response. The main focus this week will be on the NonFarm Payrolls report and the unemployment rate.
Today, traders may stay in short positions with targets of 1.3391 and 1.3377, as the price bounced off the area of 1.3465-1.3480. Long positions can be opened if a bounce occurs off the area of 1.3369-1.3491 with a target of 1.3465-1.3480.
Díky analytickým přehledům společnosti InstaForex získáte plné povědomi o tržních trendech! Jako zákazníkovi společnosti InstaForex je Vám k dispozici velký počet bezplatných služeb umožňujících efektivní obchodování.


