 Zůstat

Obchodní podmínky
Nástroje


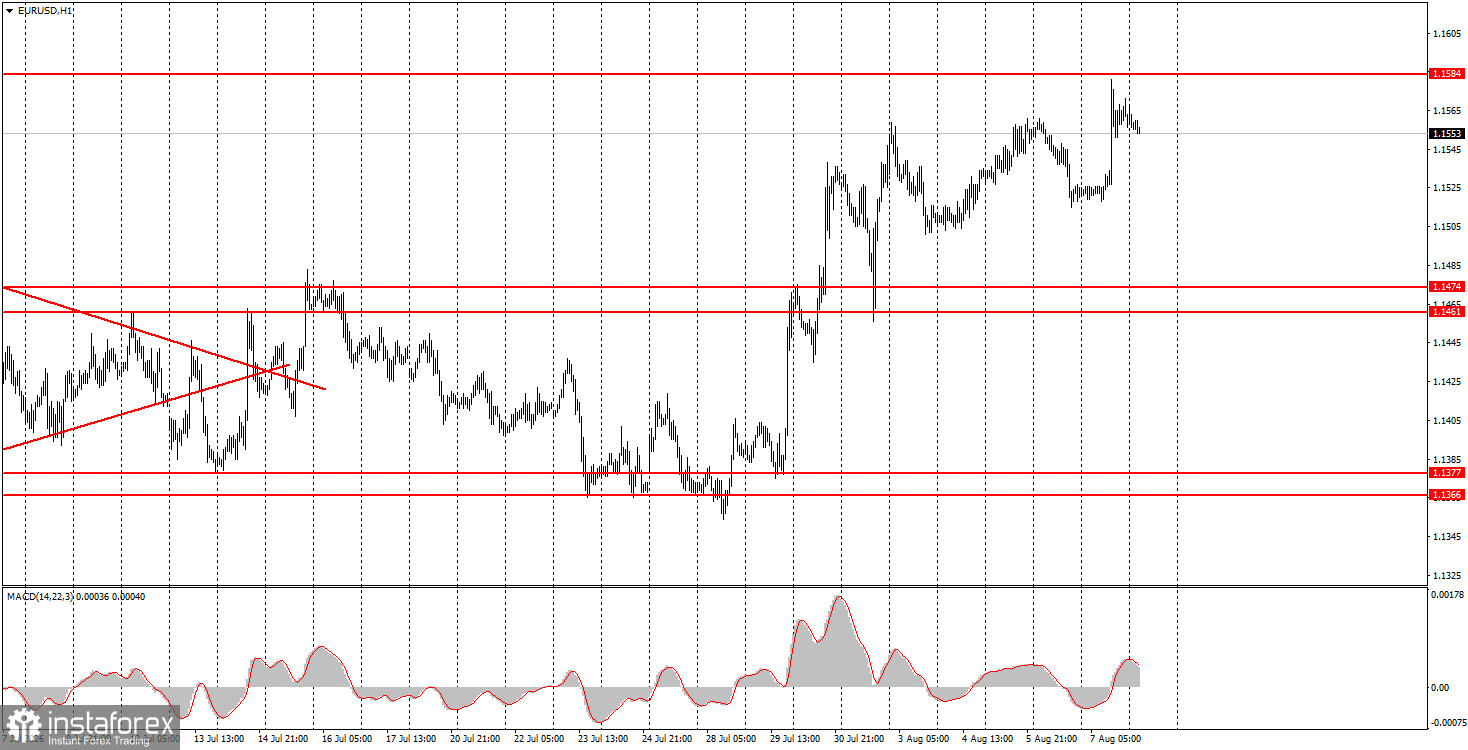
The EUR/USD currency pair showed a confident, but not the strongest, rise in Friday trading. For novice traders, the day turned out to be both fairly simple and complicated at the same time. From the very beginning, it was clear that everything would hinge on the NonFarm Payrolls report, which the market had been waiting for since the start of the week and on which the fate of Federal Reserve monetary policy depends. However, it was impossible to predict the value of this report in advance. Official forecasts indicated that nonfarm payrolls in July would be around 80,000. The actual report value was -20,000. The difference is 100,000. In addition, the values for the two previous months were revised downward by another 100,000. Thus, in effect, only on Friday the labor market was short 200,000 jobs. Naturally, this situation led to a decline in the US currency. And we believe it was too weak. The US dollar will likely continue to decline, since the chances of Fed policy tightening in September are now minimal.
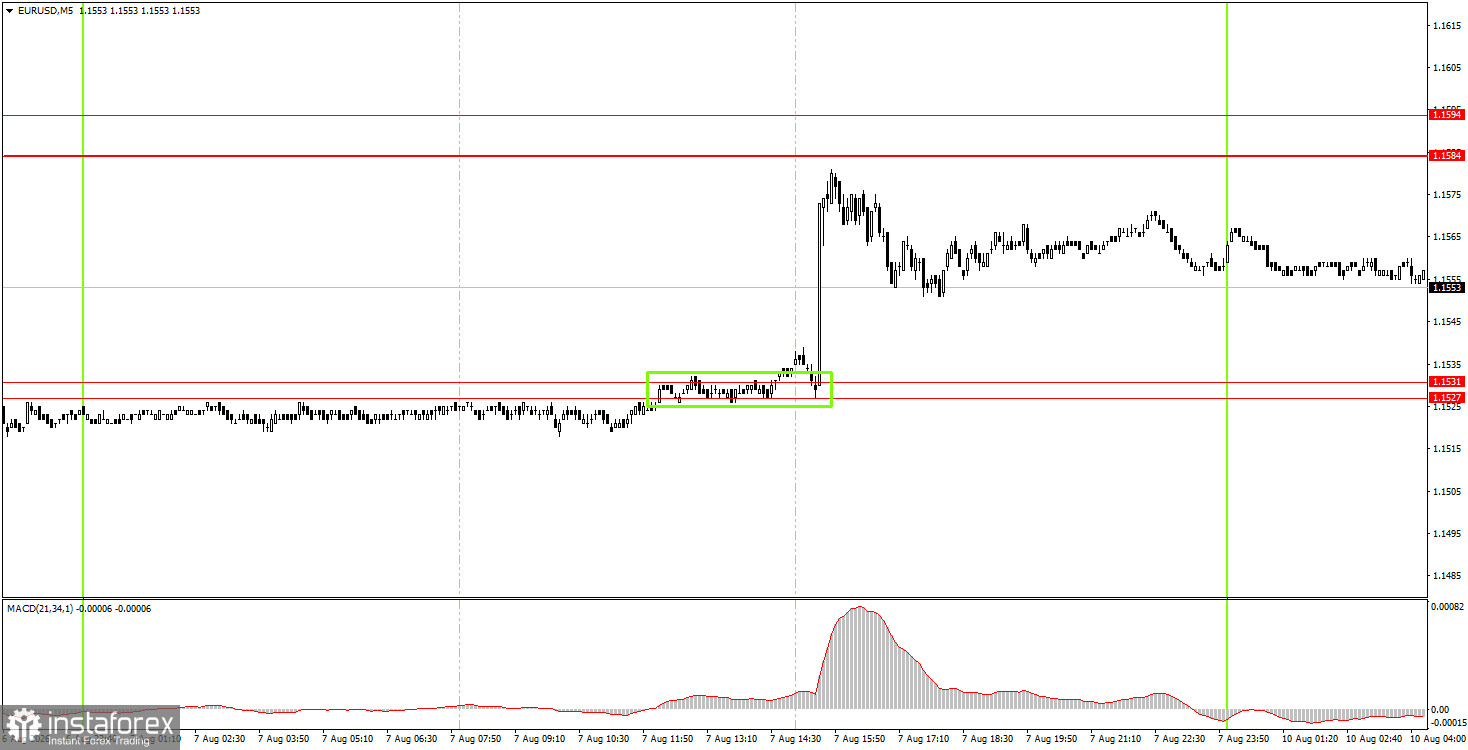
On the 5-minute TF on Friday, exactly one trading signal was formed. At the start of the American trading session, the price broke through the 1.1527–1.1531 area, allowing long positions to be opened. However, it was quite difficult to trade that signal because the price shot up within 5 minutes.
On the hourly timeframe, the price has left the sideways channel it spent a month in and continues to form a new uptrend. Taking into account all events of recent months, we believe the euro should continue a steady rise. Recently, the market has been actively ignoring almost all factors in favor of the euro, so a correction and adjustment toward fair value are now underway.
On Monday, novice traders may open short positions targeting 1.1461–1.1474 if the price consolidates below the 1.1527–1.1531 area. Long positions can be opened in case of a rebound from the 1.1527–1.1531 area with a target of 1.1584–1.1594.
On the 5-minute TF, consider the levels 1.1267–1.1275, 1.1366–1.1377, 1.1461–1.1474, 1.1527–1.1531, 1.1584–1.1594, 1.1655–1.1666, 1.1745–1.1754. On Monday, there are no important events or publications scheduled in the EU or the US. There will be nothing to react to during the day, so volatility will most likely be low.
Support and resistance price levels (areas) are the targets when opening buy or sell orders or sources of signals.
Red lines denote channels or trend lines that reflect the current trend and indicate in which direction trading is currently favored.
The MACD indicator (14,22,3) – histogram and signal line – is a supporting indicator that can also be used as a source of signals.
Important speeches and reports (as listed in the news calendar) can significantly influence the movement of the currency pair. Therefore, during their release, trading should be approached with utmost caution, or one should exit the market to avoid sharp price reversals against the preceding movement.
Beginners in Forex trading should remember that not every trade can be profitable. Developing a clear strategy and proper money management are essential for long-term trading success.
Díky analytickým přehledům společnosti InstaForex získáte plné povědomi o tržních trendech! Jako zákazníkovi společnosti InstaForex je Vám k dispozici velký počet bezplatných služeb umožňujících efektivní obchodování.


