 Zůstat

Obchodní podmínky
Nástroje


The GBP/USD currency pair attempted to continue its upward movement on Wednesday, but nothing came of it, and by the end of the day the price fell below the opening level. Based on this fact, several important conclusions can be drawn. First, the market effectively ignored the slowdown in US inflation, which significantly reduces the likelihood of a Federal Reserve rate hike in September. The US dollar should have fallen on that factor, but instead it rose by the end of the day. Second, on the hourly TF, it is clearly visible that each of the last three highs is essentially a liquidity sweep from the previous high. The bulls have run out of steam, so a near-term downward correction is possible. We do not believe the pair's decline will be strong or prolonged, but it seems the time for a correction has come. The most important report of the week has already been published, and geopolitics is unlikely to support the US currency in the near term, since the Middle East conflict has stalled in all directions. At present, there are no active military operations, no negotiations, no chance of peace, and no one desires to renew the war. The pair's volatility has fallen to its lowest values.
In technical terms, the British pound continues to form an upward trend on the hourly TF, as evidenced by the trendline. It should be recalled that, in the long term, the pair is in a sideways channel and can quite well continue moving from the lower boundary to the upper one. The 1.3465–1.3488 area provides strong support for the pound, and the trendline lies slightly below it. It will not be easy for the dollar to rise.
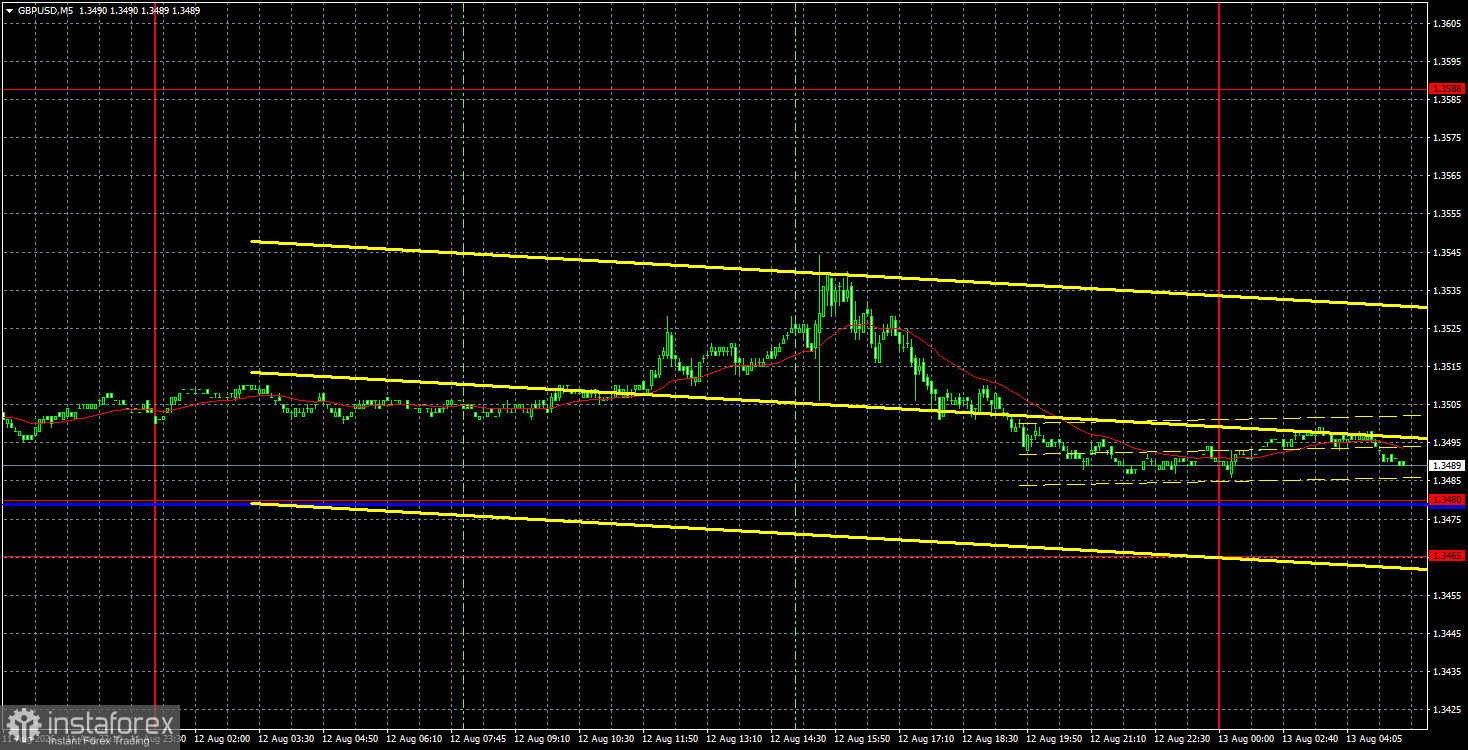
On the 5-minute TF on Wednesday, not a single trading signal was formed. During the day, the price showed both upward and downward movement, but failed to work off either the Kijun-sen line or the 1.3465–1.3480 area. Signals are expected to form today.
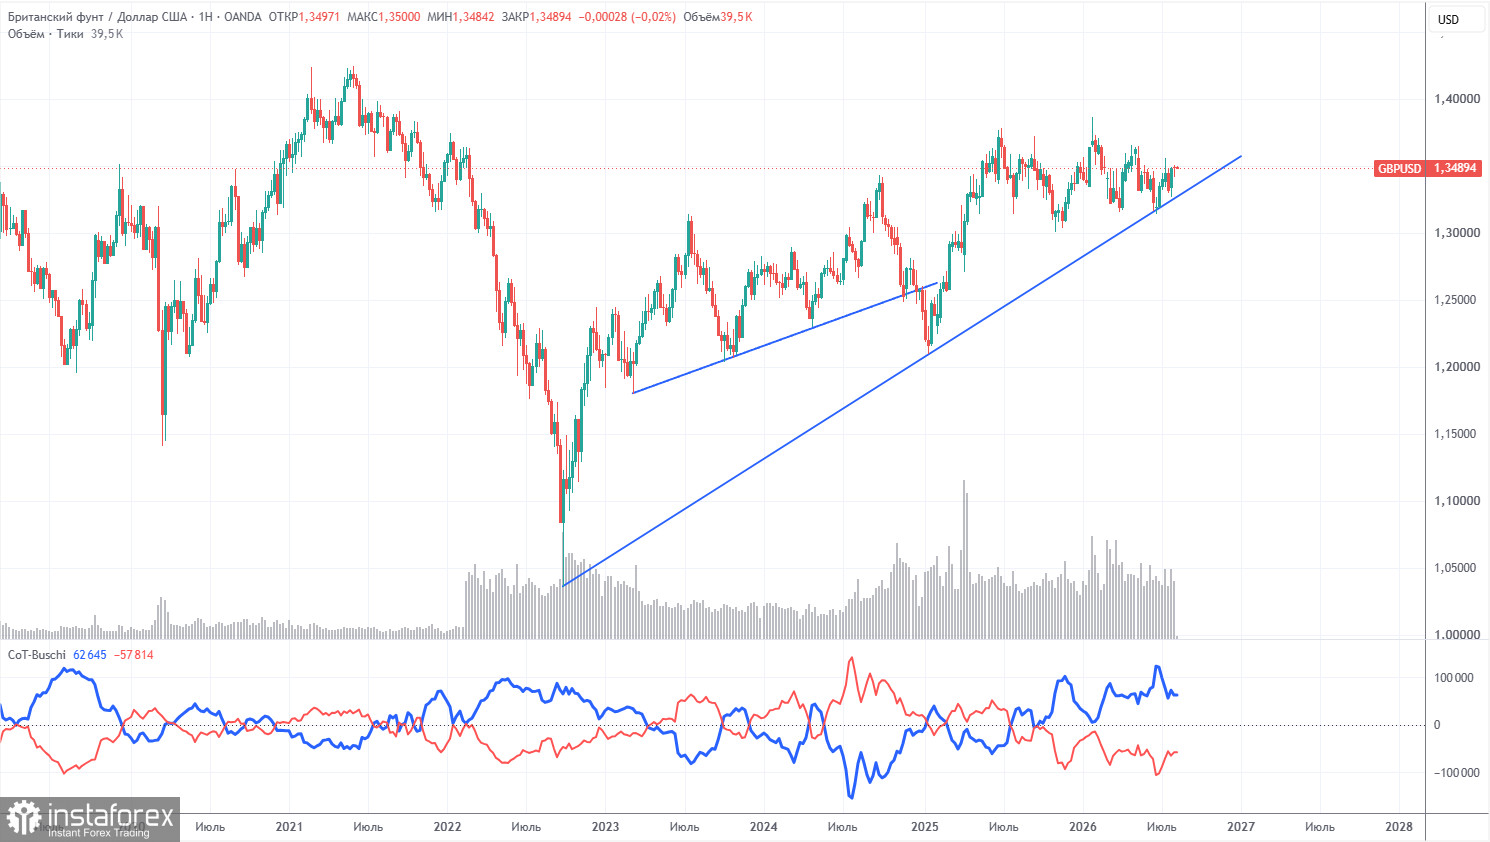
COT reports for the British pound show that non-commercial traders have dominated the market with sales for several months now. The net position is negative despite the preservation of the long-term uptrend. Given events in the Middle East, it is not surprising that demand for risk currencies remains weak. The war is formally over, but the conflict persists. Geopolitics may support demand for the US dollar in the near term. However, until consolidation below the trendline occurs, we would not expect a strong fall in the pair.
In the long term, the dollar will continue to decline due to Donald Trump's policies, which is clearly visible on the weekly TF. The trade war will continue in one form or another for a long time, and Trump's policy is aimed, both directly and indirectly, at weakening the US currency. The long-term uptrend remains relevant, as evidenced by the trendline. The price recently tested that line and bounced off it. According to the latest COT report (dated August 4), the "Non-commercial" group closed 6,500 BUY contracts and 13,500 SELL contracts. Thus, the net position of non-commercial traders increased by 7,000 contracts.
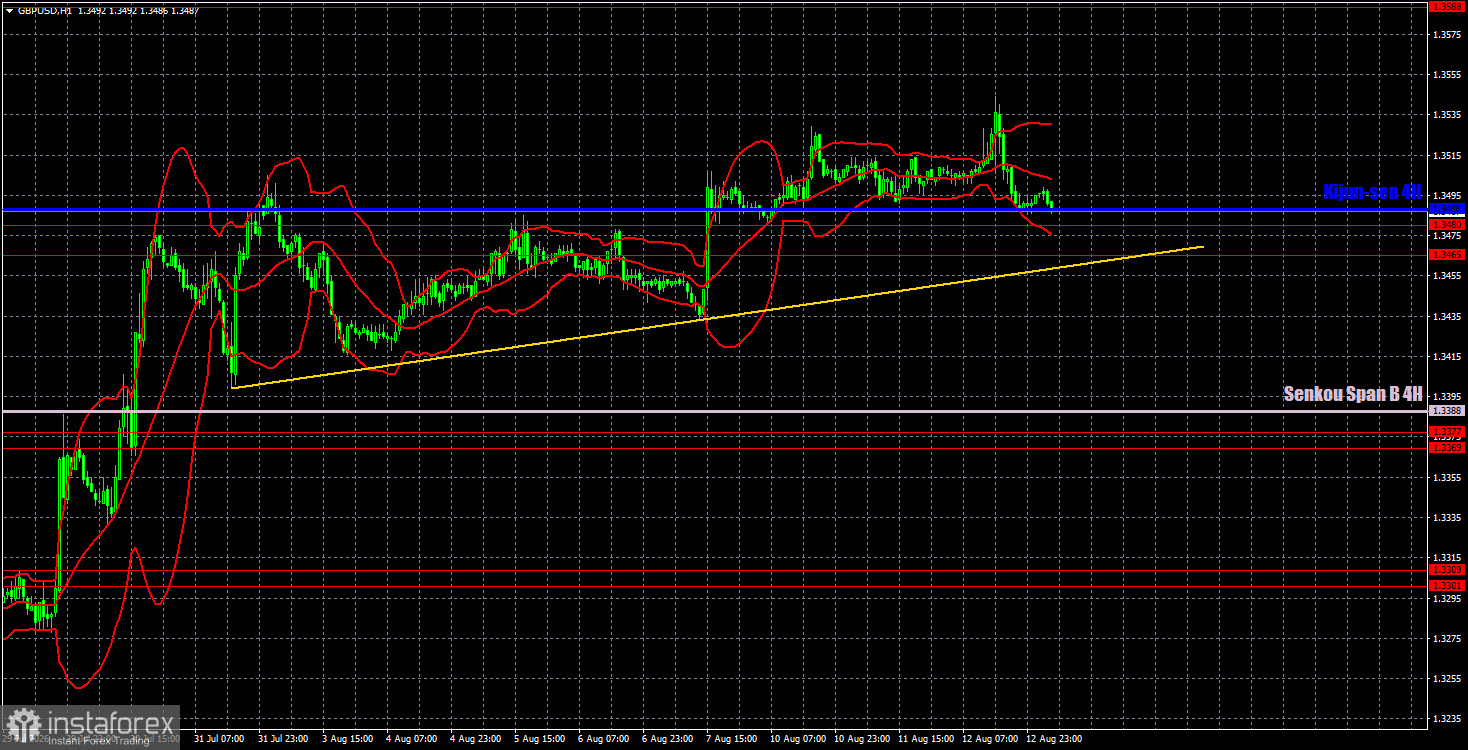
On the hourly TF, the GBP/USD pair continues to form an upward trend. In the long term, both European currencies still "look" upward and have been in sideways channels for a full year, which does not negate the uptrend that began in 2022. We expect the pound sterling to continue rising in the coming weeks. The upward trend will be interrupted if the price consolidates below the trendline.
For August 13 we highlight the following important levels: 1.3042–1.3050, 1.3096–1.3115, 1.3179–1.3187, 1.3301–1.3309, 1.3369–1.3377, 1.3465–1.3480, 1.3588, 1.3671–1.3681. The Senkou Span B (1.3388) and Kijun-sen (1.3488) lines can also be sources of signals. It is recommended to move the stop loss to breakeven if the price moves 20 pips in the favorable direction. Ichimoku indicator lines may shift during the day, which should be taken into account when determining trading signals.
On Thursday, the UK will publish Q2 GDP and industrial production reports. We cannot call these data important for the GBP/USD pair, since the market pays more attention to US data. Nevertheless, some reaction may follow these releases. In the US today, there is only the producer price index, which means little after yesterday's inflation.
Today, traders may open short positions with a target of 1.3388 if the price consolidates below the 1.3465–1.3480 area and the Kijun-sen line. Long positions can be opened in the event of a rebound from the 1.3465–1.3480 area or the critical line with a target of 1.3588.
Price support and resistance levels (resistance/support) – thick red lines near which movement may end. They are not sources of trading signals.
Kijun-sen and Senkou Span B lines – Ichimoku indicator lines transferred to the hourly timeframe from the 4-hour. They are strong lines.
Extreme levels – thin red lines from which price previously bounced. They are sources of trading signals.
Yellow lines – trend lines, trend channels, and any other technical patterns.
Indicator 1 on the COT charts – the size of the net position of each trader category.
Díky analytickým přehledům společnosti InstaForex získáte plné povědomi o tržních trendech! Jako zákazníkovi společnosti InstaForex je Vám k dispozici velký počet bezplatných služeb umožňujících efektivní obchodování.


