 Zůstat

Obchodní podmínky
Nástroje


Bitcoin has effectively stalled for nearly three weeks after a sharp $18,000 surge. It is worth remembering that within strong trends, Bitcoin will often pause and then, sometimes without a deep correction, produce another powerful move. The current inability of Bitcoin to extend higher therefore does not necessarily mean the local northward impulse is exhausted—but that impulse is local. On the daily time frame, BTC is essentially range-bound. Movements on the daily chart for 2026 do not look flat, but they do on the weekly chart, and any time frame can form a flat. If that time frame is weekly, the flat can last years. Crucially, bitcoin is now near the upper boundary of the sideways channel, which means a deviation that removes liquidity from the prior high or at least a simple retracement is plausible. In any case the downtrend is not broken.
This week, the US will publish August inflation data, the last major release ahead of the Fed meeting. Bitcoin's appeal is sensitive to Fed policy: the softer policy is, the better for risk assets. While rate cuts are not on the horizon, the market priced higher odds of tightening for the past three months—not ideal for bitcoin. In our view, the probability of monetary tightening in September remains low. We believe US labor market momentum is weak and the economy has slowed for several quarters. Last week Christopher Waller and John Williams said they do not see reasons for tightening, so we rate the odds of a September hike as low. The CPI print on September 11 could push those odds up or down. If August CPI confirms disinflation, a pause is likely; hot inflation would increase hike odds and pressure Bitcoin. Thus, the inflation print, not payrolls, is the decisive catalyst through the Fed decision.
General BTC/USD picture on 1D
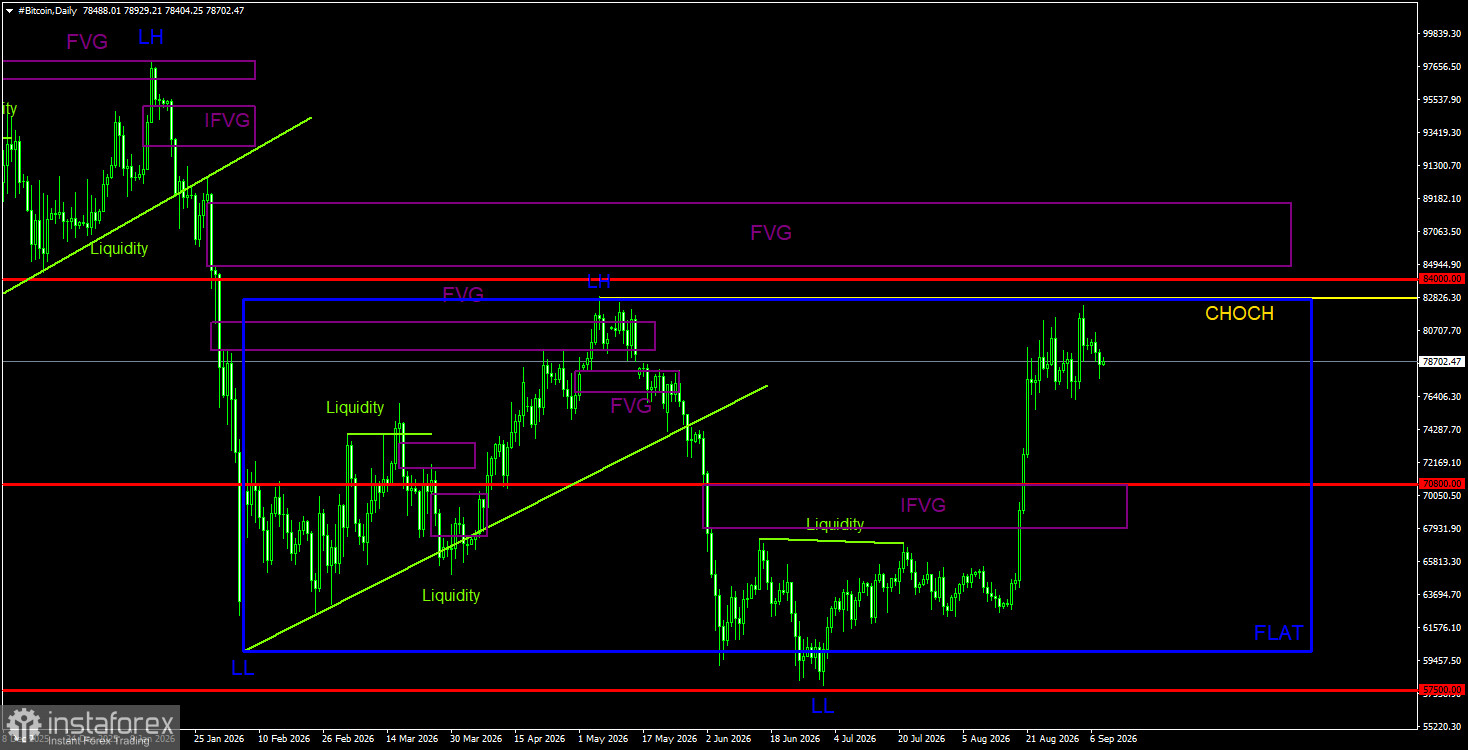
On the daily time frame, Bitcoin remains in a downtrend and has moved into a flat. The trend structure is identifiable as bearish, and the CHOCH level sits at $82,800, where the last lower high formed. Only above that level can one argue the downtrend has ended. For most of 2026, BTC traded between $60,000 and $82,500, which implies the price can pull liquidity from the last LH and start a new move to the lower boundary of the sideways channel.
General BTC/USD picture on 4H
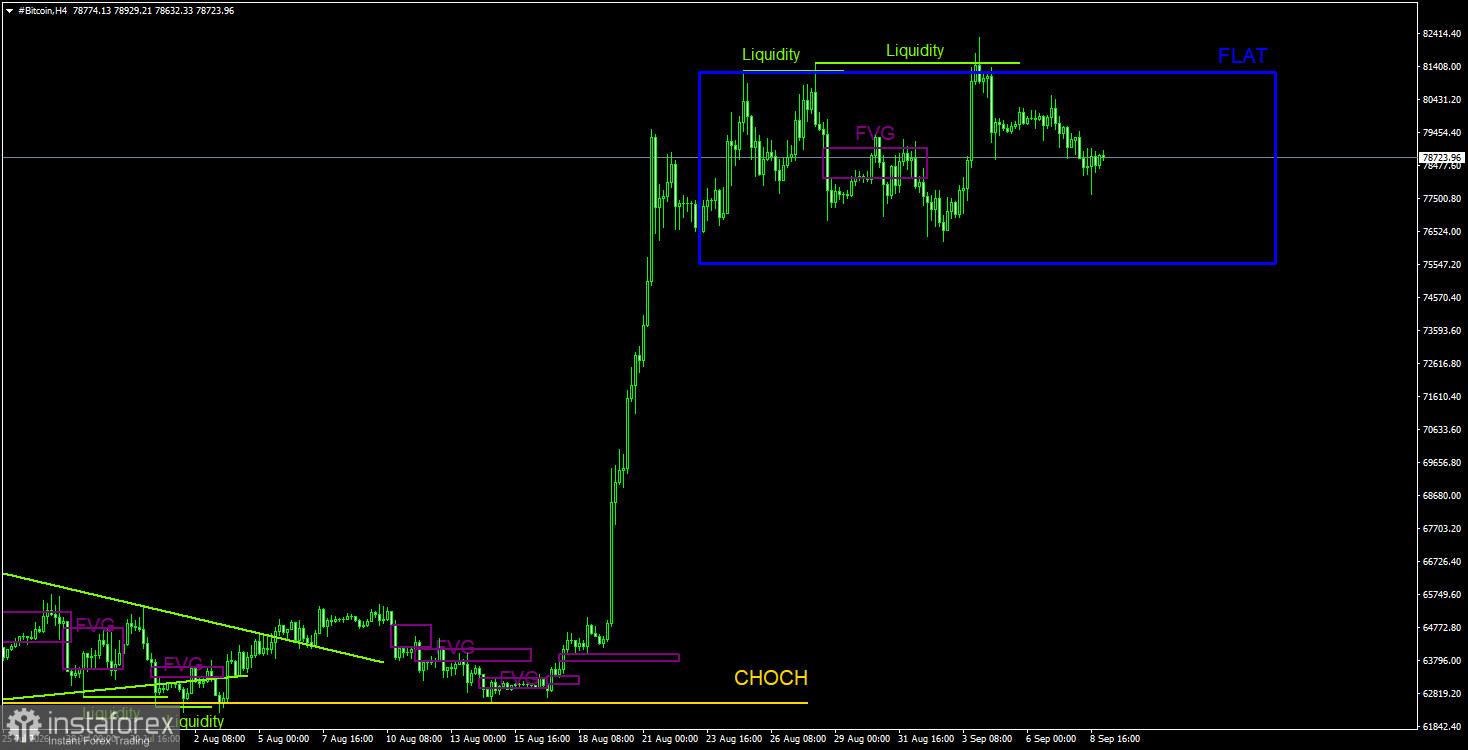
On the 4-hour time frame, Bitcoin is also in an obvious flat and has twice taken liquidity to sell, forming two deviations at the channel's upper boundary. Traders therefore received at least two sell signals, suggesting a drop equal to 50% and 100% of the channel width are possible targets. After these two upper-boundary deviations, we assess the probability of a powerful downside leg as higher than a breakout to the upside. Remember the daily chart is also in a flat and near the upper boundary.
Trading recommendations for BTC/USD
Bitcoin remains in a downtrend despite last week's strong rally. We continue to expect a decline to $57,500 (the 61.8% Fibonacci retracement of the three-year uptrend), though that level has largely been worked off. We do not believe the downtrend has ended. The recent rise looks little like a corrective move and more like a pump. Liquidity may be taken from the $82,850 high, which could trigger a new downward leg and confirm a transition to sideways trading. On the 4-hour TF, expect another drop after a second liquidity grab at the recent highs. We consider a decline to $75,500 quite likely this week.
Illustration notes
CHOCH—change of character, or break in trend structure.
Liquidity—stop losses, pending orders, and other liquidity that market makers use to accumulate positions.
FVG—fair-value gap, a price-inefficiency zone; price moves quickly through these areas, indicating one side is absent, and later price tends to return and react there in continuation of the main trend.
IFVG—inverted fair-value gap. After a return to such an area, price does not react but instead breaks impulsively and then retests from the other side.
OB—order block: a candle where a market maker executed to take liquidity and form a position in the opposite direction.
Risk management reminder: remain disciplined with stops and position size—flats can persist, and deviations can produce sharp, short-lived moves.
Díky analytickým přehledům společnosti InstaForex získáte plné povědomi o tržních trendech! Jako zákazníkovi společnosti InstaForex je Vám k dispozici velký počet bezplatných služeb umožňujících efektivní obchodování.


