 Zůstat

Obchodní podmínky
Nástroje


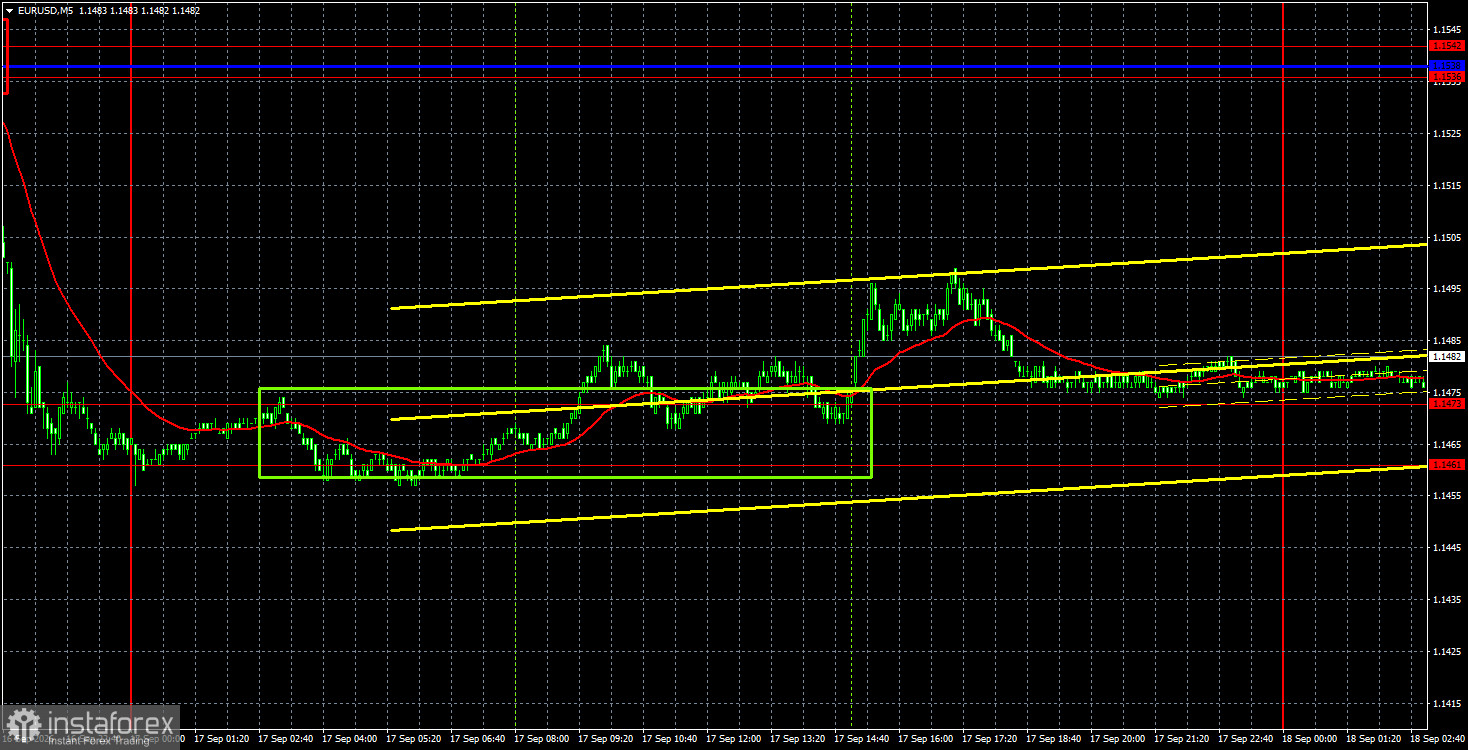
The EUR/USD pair spent Thursday trying to stage at least a modest corrective move. During the day, the euro-area second-estimate CPI for August was released, and US construction-sector reports came out. The market largely ignored the second estimate of the CPI, while US construction data disappointed forecasts and prompted a small pullback in the dollar. That said, there is no strong evidence that traders sold the dollar specifically on those reports — it is equally possible the pair simply produced a technical correction after the sharp decline, with short-covering taking place. In any case, the pair began a corrective lift from the 1.1461–1.1473 area that may now extend toward the descending trend line. We still see no solid fundamental support for sustained dollar strength beyond Federal Reserve policy: even that case is debatable because the European Central Bank has already tightened in 2026 roughly as many times as the Fed may hypothetically do. If the market ignores positive factors for the euro, the euro will not rally.
Technically, a downtrend continues to form and now looks like a full-blown trend. The market again ignored the ECB's hawkish move but aggressively priced the Fed's hike. If that pattern persists, the dollar may continue to strengthen for a long time.
On the 5-minute timeframe on Thursday, one buy signal formed. During the European session, price bounced from the 1.1461–1.1473 area, enabling traders to open long positions. However, the euro's advance was weak and short-lived; price returned into the zone, and a new signal may form today.
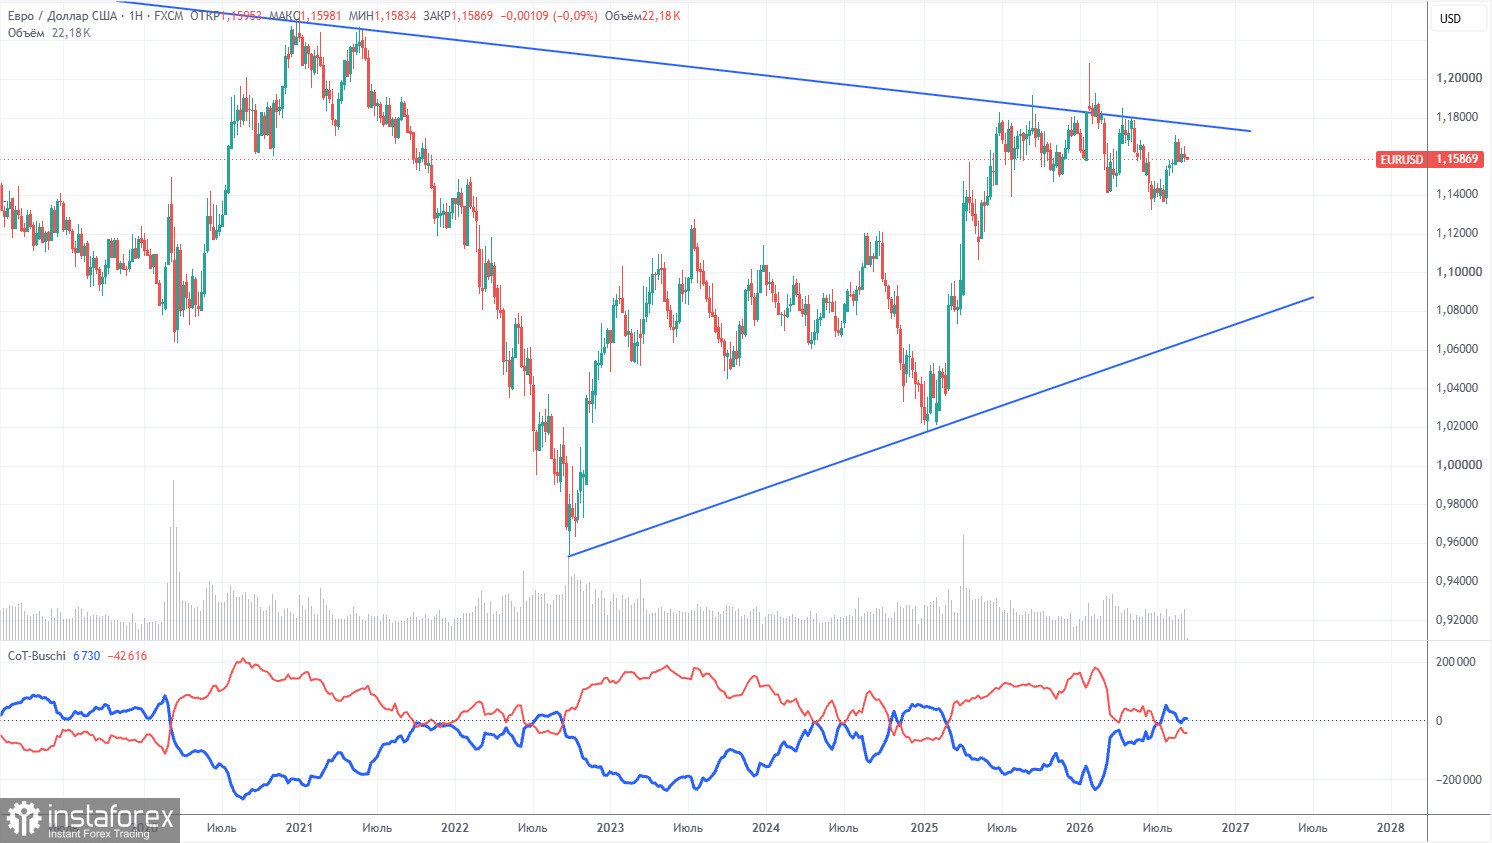
The latest COT report is dated September 8. On the weekly timeframe, it is clear that non-commercial traders' net position turned bearish and fell significantly in 2026 amid geopolitical events. Traders have been reducing euro exposure in favor of the US dollar over the past six months. Trump's policy has not changed, but the dollar acted as a reserve currency for a period.
However, we still do not see fundamental factors that justify further dollar strengthening. The Middle East war made the dollar temporarily super-attractive, but when that factor's "shelf life" expires, everything should return to normal — and that shelf life may already be over. In the long run, the euro could fall as low as $1.08 (trend line), but the long-term uptrend remains intact. During recent months of dollar strength, the pair has not come close to that trend line.
The placement of the red and blue indicator lines indicates approximate parity between bulls and bears. During the last reporting week, longs in the "Non-commercial" group fell by 500 while shorts rose by 12,700. Accordingly, net positions fell by 17,700 contracts for the week.
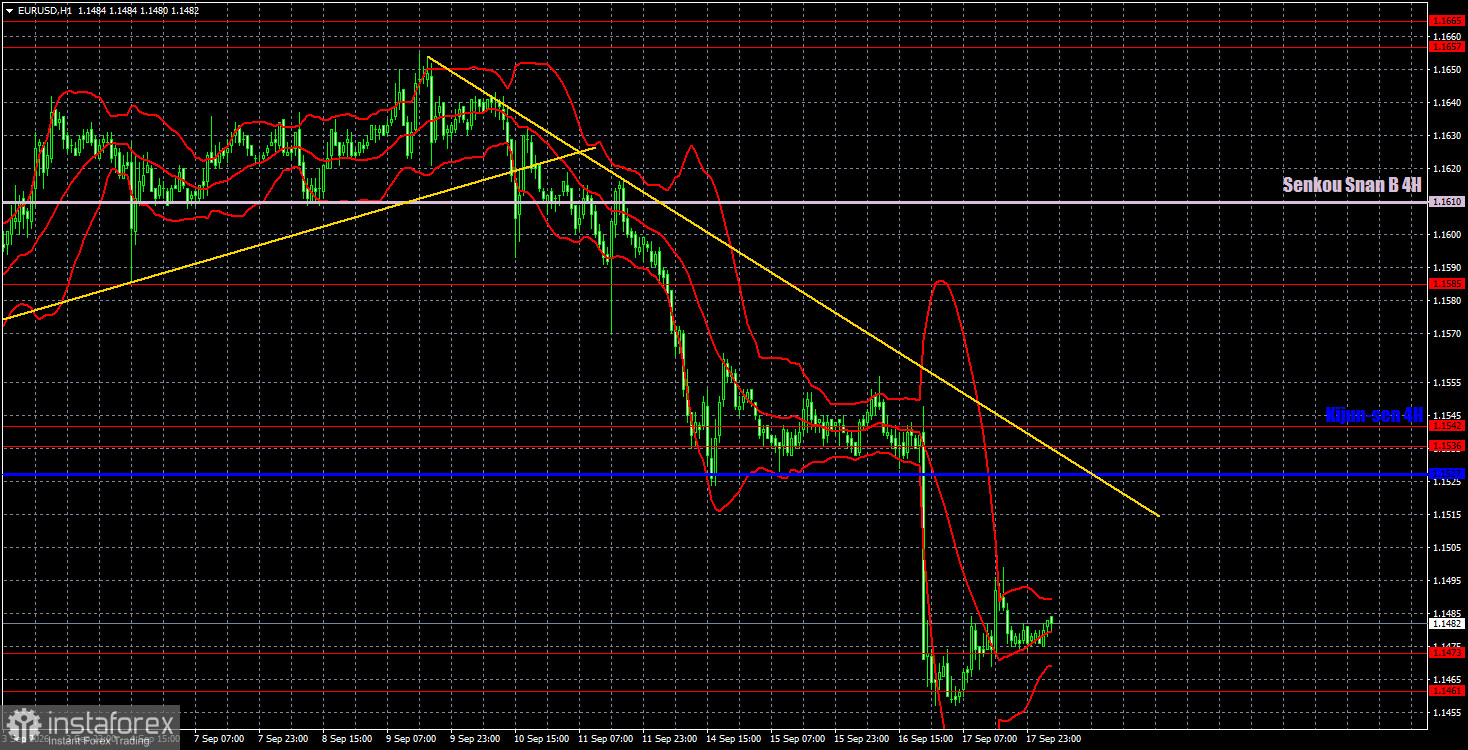
On the hourly timeframe, EUR/USD continues to form a downward trend, and the Fed strongly supported the downward move. The ECB should have supported the euro last week, since it raised rates for the second time in 2026, but the market now sees only the Fed and its tightening. Thus, the dollar has effectively formed a new trend out of thin air, and market sentiment may remain fully bearish going forward.
For September 18 we highlight the following trading levels — 1.1234, 1.1274, 1.1362–1.1368, 1.1461–1.1473, 1.1536–1.1542, 1.1585, 1.1657–1.1665, 1.1750–1.1760, 1.1786, 1.1830–1.1837, as well as the Senkou Span B line (1.1610) and the Kijun-sen (1.1527). The Ichimoku indicator lines may shift during the day, which should be taken into account when determining trading signals. Remember to move the Stop Loss to breakeven if the price moves 15 pips in the right direction. This will protect against possible losses if the signal proves false.
On Friday, ECB President Christine Lagarde will speak, but she is unlikely to announce anything important just a week after the ECB meeting and rate hike. In the US today, the industrial production report is due, which likewise has a very low chance of provoking a market reaction.
Today traders may consider short positions targeting 1.1362–1.1368 if price consolidates below the 1.1461–1.1473 area. A bounce from the 1.1461–1.1473 area will allow you to open long positions targeting 1.1527–1.1542. Volatility today may be low.
Support and resistance price levels are thick red lines where movement may conclude. They are not sources of trading signals.
The Kijun-sen and Senkou Span B lines are Ichimoku indicator lines transferred to the hourly timeframe from the 4-hour timeframe. They are strong lines.
Extreme levels are thin red lines from which the price has previously rebounded. They are sources of trading signals.
Yellow lines indicate trend lines, trending channels, and any other technical patterns.
Indicator 1 on COT charts shows the size of the net position of each category of traders.
Díky analytickým přehledům společnosti InstaForex získáte plné povědomi o tržních trendech! Jako zákazníkovi společnosti InstaForex je Vám k dispozici velký počet bezplatných služeb umožňujících efektivní obchodování.


