 Zůstat

Obchodní podmínky
Nástroje


Spot Bitcoin and Ethereum ETFs suffered nearly $1 billion in net outflows in October: $986.3 million in total. Bitcoin ETFs lost $244.1 million on Thursday alone after $484.9 million on Wednesday — the largest daily outflow since June 25. Wednesday's figure refines a preliminary estimate I gave earlier. Bitcoin fell to $80,427 yesterday and is now trading around $82,500.

The dynamics are telling. Bitcoin funds have lost $407.4 million in October, but about $729 million left over the past two days, so the month had been roughly +$320 million through Wednesday. In other words, inflows from the early days of the month were wiped out in two days of selling. Ethereum's picture is worse: funds lost $72.5 million on Thursday, marking the eighth consecutive trading session of outflows. Since the streak began on September 29, they have lost about $641.3 million, and the October total stands at $578.9 million — more than Bitcoin despite a much smaller market size.
The causal chain is clear. The September Fed minutes showed most participants view another rate hike this year as likely. US yields rose to multi-year highs, oil reacted to reports of possible strikes on Iran, and institutional investors using ETFs as a simple in/out channel cut risk. Winners were those who exited near the $86,000 peak; losers were recent fund buyers: IBIT's average cost basis is estimated at roughly $81,200–$82,200, meaning the current price is around the largest fund's breakeven. If price falls below that, pressure on this segment will intensify.
A convincing confirmation of a breakdown would be rising spot trading volumes and a return of ETF buying. So far, that is absent: today's rally on Trump's comments that there will be no strikes on Iran before November 3 looks like short covering rather than new capital entering. My base case: until outflows from funds reverse into inflows, rallies will be sold, and the first reversal signal will be at least one day of material net inflows into Bitcoin ETFs.
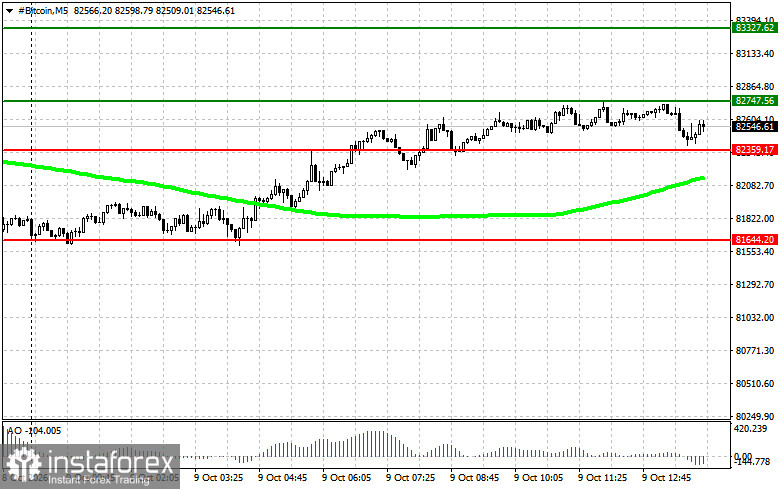
Bitcoin technical
The instrument is trading in a narrow corridor between support at $82,300 and resistance at $82,700; outer bounds are $81,600 and $83,300. The plan is built around two mirror scenarios with full breakout and bounce setups. There are two entries for longs. First, a confirmed breakout above $82,700: buy targeting $83,300, where I take profits and consider a short position on the pullback, provided price is above the 50-day MA and the Awesome Oscillator is above zero. Second, buy the bounce off $82,300 if a downside breakout failed and proved false: target first $82,700, then 483,300.
Short positions are the mirror image. On a confirmed break below $82,300, consider a short targeting $81,600, provided the MA is above price and Awesome is below zero. If a breakout above $82,700 fails and price returns below that level, start a short from resistance aiming back to $82,300 and then $81,600.
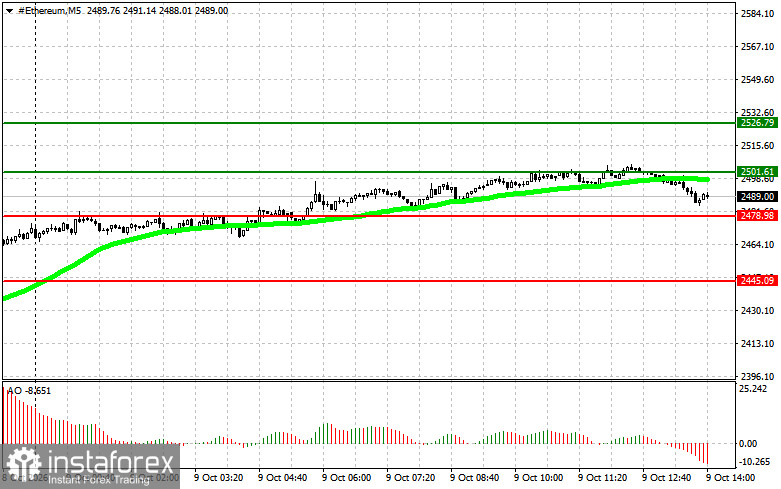
Ethereum technical
The logic mirrors Bitcoin on its own price scale — inner corridor between support $2,478 and resistance $2,501; outer bounds are $2,445 and $2,526. Buy on a confirmed break above $2,501 targeting $2,526, where take profits and consider a short on the pullback; same conditions apply — the price above the 50-day MA and Awesome above zero. Buy on a bounce from $2,478 if a downside breakout is unconfirmed, aiming first for $2,501, then $2,526.
For short positions, a confirmed break below $2,478 opens a short targeting $2,445, provided the MA is above price and Awesome is below zero. A failed breakout above $2,501 that reverses enables short positions back to $2,478, then 2,445.
Both indicators serve as filters to weed out false moves rather than standalone entry signals; decisions are taken only after price confirmation of the specified levels.
Díky analytickým přehledům společnosti InstaForex získáte plné povědomi o tržních trendech! Jako zákazníkovi společnosti InstaForex je Vám k dispozici velký počet bezplatných služeb umožňujících efektivní obchodování.


