 Zůstat

Obchodní podmínky
Nástroje


Bitcoin rose to $84,250 in the morning but then printed a daily low and now trades at $83,500. Ether is also struggling to rally, trading around $2,552. The early move was linked to oil: in the Asian session it fell, probably after Donald Trump's Friday statement about an agreement under which Russia would put 300,000 tons of diesel onto international and domestic markets. In effect, this is a partial easing of US sanctions on Russian oil.

However, the support proved to be short-lived. Although Trump also spoke of an immediate energy truce between Russia and Ukraine, Kyiv said it was not consulted. When the main growth stimulus disappears within hours, the market returns to real problems, and the chief one lies in flows.
Last week, US spot Bitcoin ETFs saw $681m leave, the largest weekly outflow since June, according to SoSoValue, and almost all of it came on Wednesday and Thursday. That indicates institutional sentiment remains cautious, especially given that US bond yields reached 24-year highs last week.
There is, however, a stronger signal within the market. The rally is expanding beyond the top coins: AVAX, NEAR, FIL, and ZRO added 8–12% in 24 hours; nine of the top ten coins gained. Avalanche rose 5.1% to $10.91, Chainlink rose 2.4% to $13.35, and Solana, BNB, XRP, Dogecoin, and Cardano were also higher. To me this looks not like the start of a new trend but a redistribution of money after the recent crash, with traders buying beaten-up coins. That is insufficient for a sustainable rally: inflows into ETFs are needed, and they are still negative.
The next test will be US inflation data on October 14. My base case: until the print of Bitcoin, it will trade in a narrow range under pressure from ETF outflows and yields. Weak inflation will restore risk appetite and open the way to $85,000, while a strong print will boost rate hike bets and lead to another test of the lows near $80,000.
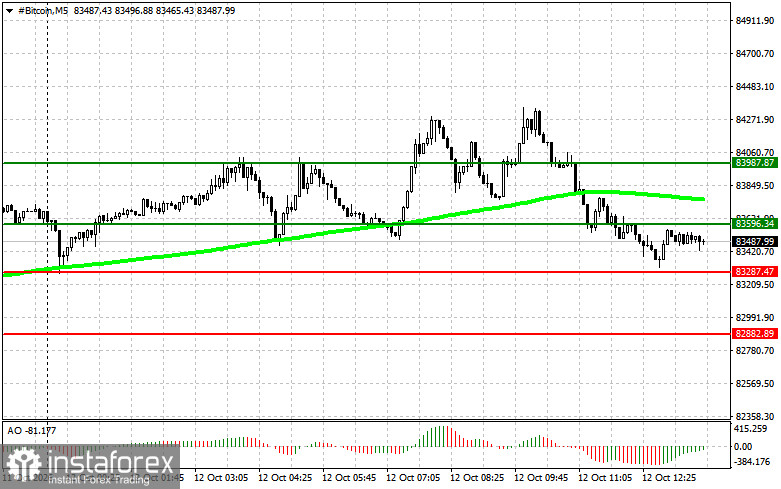
Technical picture for Bitcoin
The asset trades in a narrow corridor between support at $83,300 and resistance at $83,600, with outer boundaries at $82,800 and $83,900, and the plan is built around two mirror directions with a full set of breakout and rejection scenarios. For long orders, there are two entries. First, a break above $83,600 with confirmation: buy targeting $83,900, where I would take profit and consider shorting the retracement, provided the price remains above the 50-day moving average and the Awesome indicator is above zero. Second, a bounce from $83,300 if a downside breakout fails and the drop proves false: buy aiming first at $83,600 and then $83,900.
Sells are symmetric. A confirmed break below $83,300 gives a short target of $82,800, but only when the 50-day average is above price and Awesome has fallen below zero. If the break above $83,600 fails and the price returns below that level, a short from resistance targets a return to $83,300 and then $82,800.
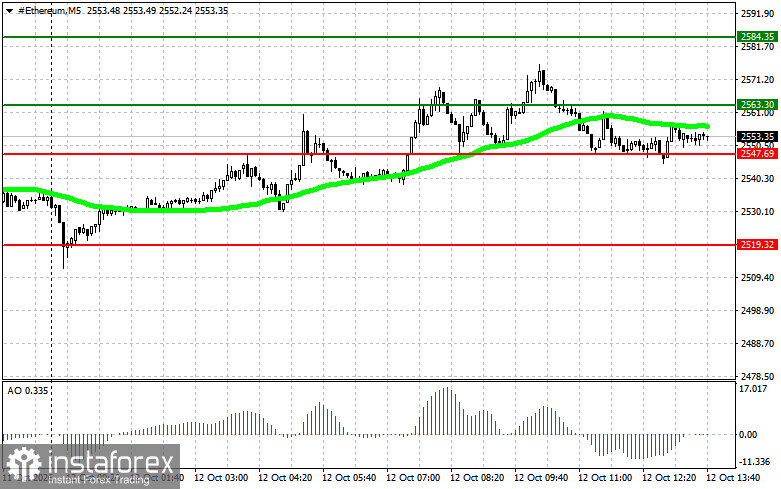
Technical picture for Ether
The logic mirrors Bitcoin on its own price scale: an inner corridor between support at $2,547 and resistance at $2,563, with outer boundaries at $2,519 and $2,584. Buy on a break above $2,563 targeting $2,584, where profit would be taken and a short on the pullback might be considered; the condition is the same—price above the 50-day moving average and Awesome above zero. Buy on a rebound from $2,547 if a downside breakout fails, with initial targets of $2,563 then $2,584.
For sells, a confirmed break below $2,547 opens a short toward $2,519 provided the 50-day average is above price and Awesome is below zero. A rejection from $2,563 after a failed upside breakout gives a short back to $2,547 and then $2,519. Both indicators are filters to avoid false moves, not standalone entry signals, so trades are taken only after the price confirms the designated levels.
Díky analytickým přehledům společnosti InstaForex získáte plné povědomi o tržních trendech! Jako zákazníkovi společnosti InstaForex je Vám k dispozici velký počet bezplatných služeb umožňujících efektivní obchodování.


